













공식 공급 업체
200 이상의 소프트웨어 개발처와 판매 계약을 맺은 공인 디스트리뷰터로서 합법적인 라이선스를 제공합니다.
모든 브랜드 보기.
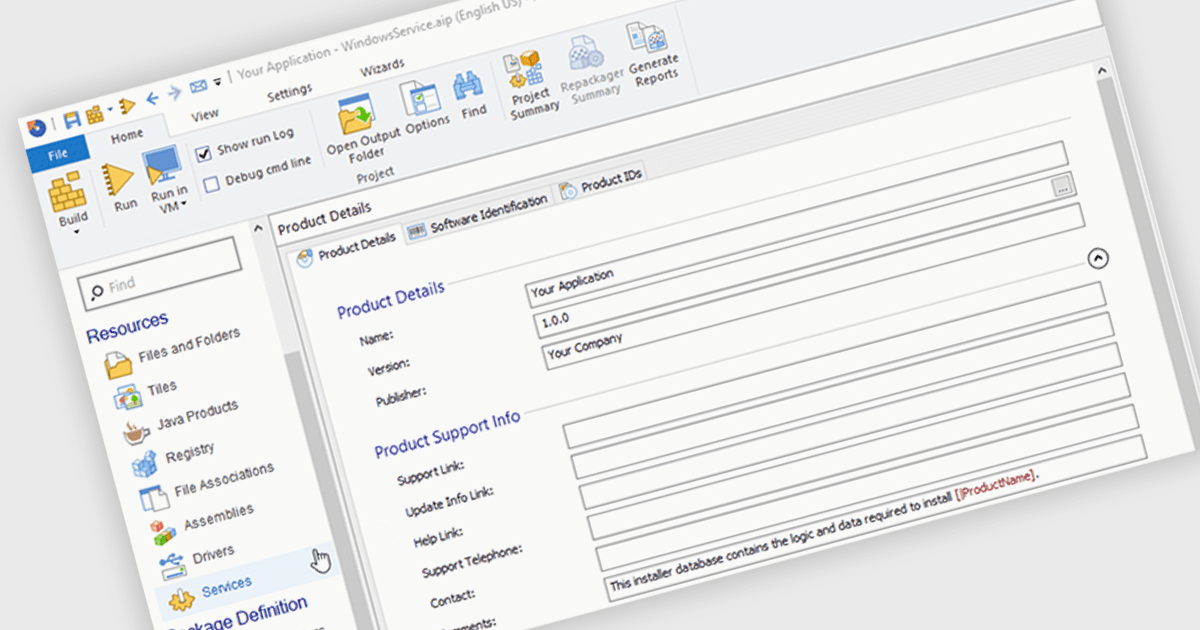
An installation tool with support for Windows services can automatically create and set up Windows services during the installation process. This functionality allows developers to automate the deployment of background tasks that run independently of user interactions. By integrating service installation into the installation process, developers can ensure that necessary services are started and running correctly after the application is installed, streamlining the setup and configuration process for both users and administrators.
Several installation tools offer support for installing Windows services including:
For an in-depth analysis of features and price, visit our comparison of Installation Tools.
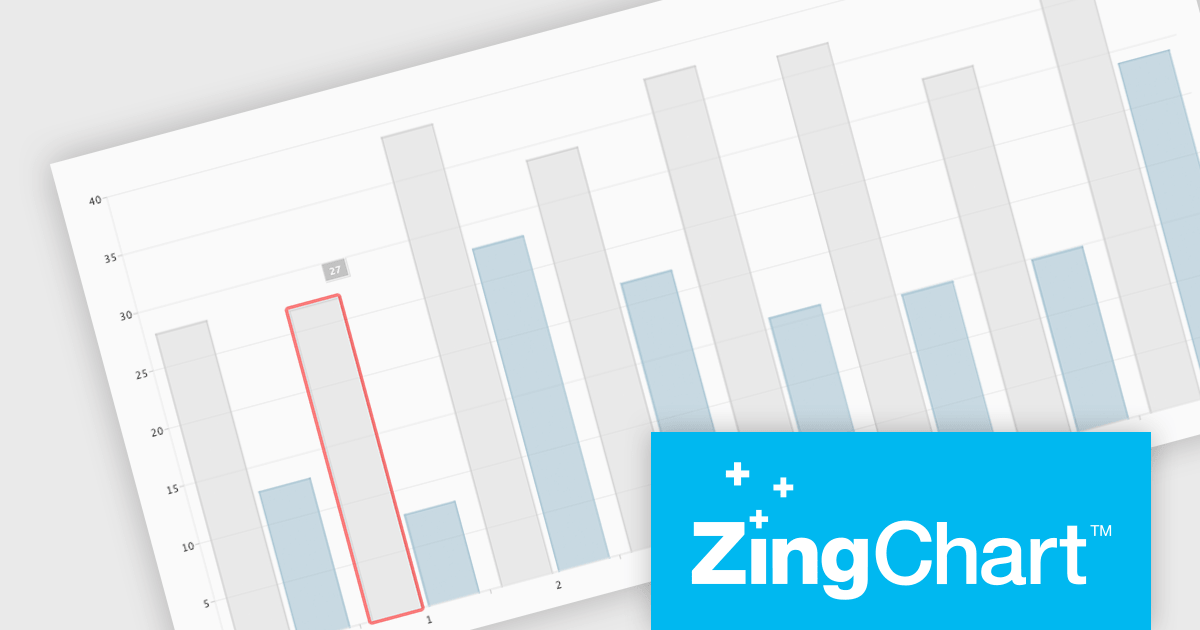
ZingChart is a powerful data visualization tool that empowers businesses to transform raw data into actionable insights. With its extensive library of customizable charts and graphs, ZingChart allows users to create visually stunning and interactive visualizations. Key features include real-time updates, data binding, and integration with popular programming languages and frameworks. By leveraging ZingChart, organizations can gain deeper understanding of their data, identify trends, and make data-driven decisions to improve efficiency and achieve business objectives.
The ZingChart 2.9.15 release improves inclusivity and accessibility. With the addition of robust keyboard navigation and speech support, users can now interact with charts effortlessly, regardless of their visual or motor abilities. By simply using their keyboard or screen reader, individuals can explore, analyze, and understand data visualization elements with ease. This significant enhancement ensures that ZingChart is a valuable tool for everyone, promoting inclusivity and accessibility in data visualization.
To see a full list of what's new in 2.9.15, see our release notes.
ZingChart is licensed on an annual or perpetual basis. It has several license options including Website, Internal, Service (SaaS), Enterprise and OEM. See our ZingChart licensing page for full details.
Learn more on our ZingChart product page.
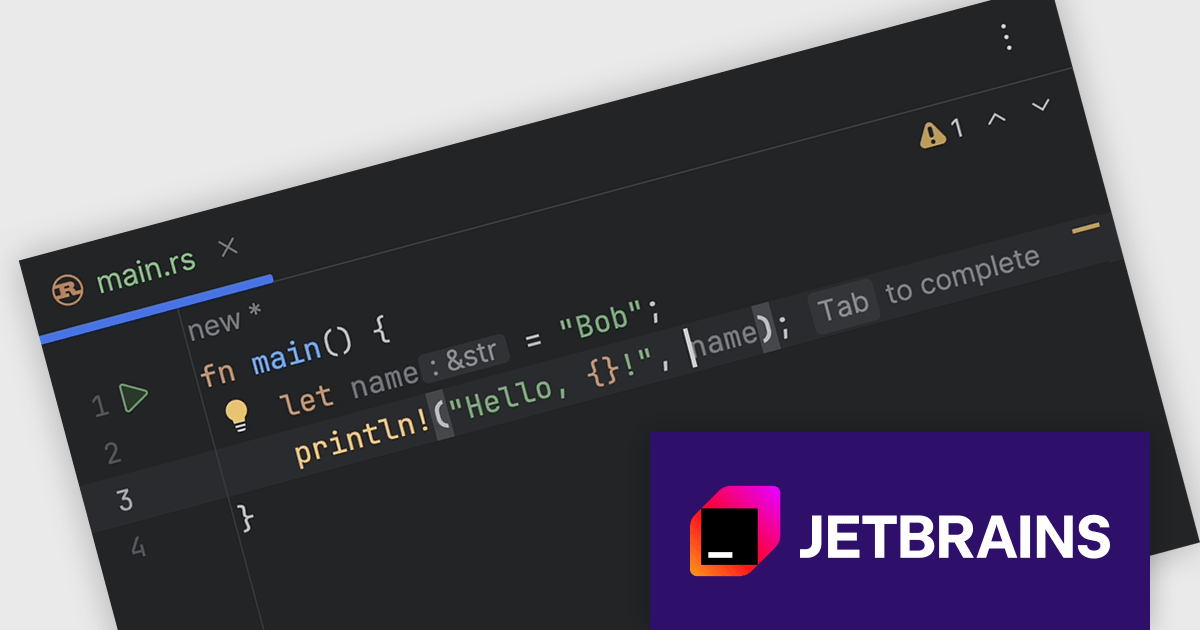
RustRover by JetBrains is a Integrated Development Environment designed specifically for the Rust programming language. It provides a comprehensive set of tools for writing and editing Rust code, all within a single program. RustRover offers advanced features tailored to Rust development, making it a powerful tool for both beginners and experienced Rust programmers.
The RustRover 2024.2 release introduces full line code completion. This powerful tool utilizes a local deep learning model to suggest entire lines of Rust code, customized to the specific context of your current project. The text suggestions, appearing as complete statements, streamline your coding process and minimize the need for manual input. By offering intelligent and context-aware code suggestions, RustRover empowers you to write code faster, more accurately, and with greater efficiency.
To see a full list of what's new in 2024.2, see our release notes.
RustRover is licensed per user, and is available as a commercial annual subscription license. We can supply new subscriptions, subscription renewals (including continuity discounts), lapsed renewals, and additional user licenses. See our RustRover licensing page for full details.
RustRover is available to buy in the following products:
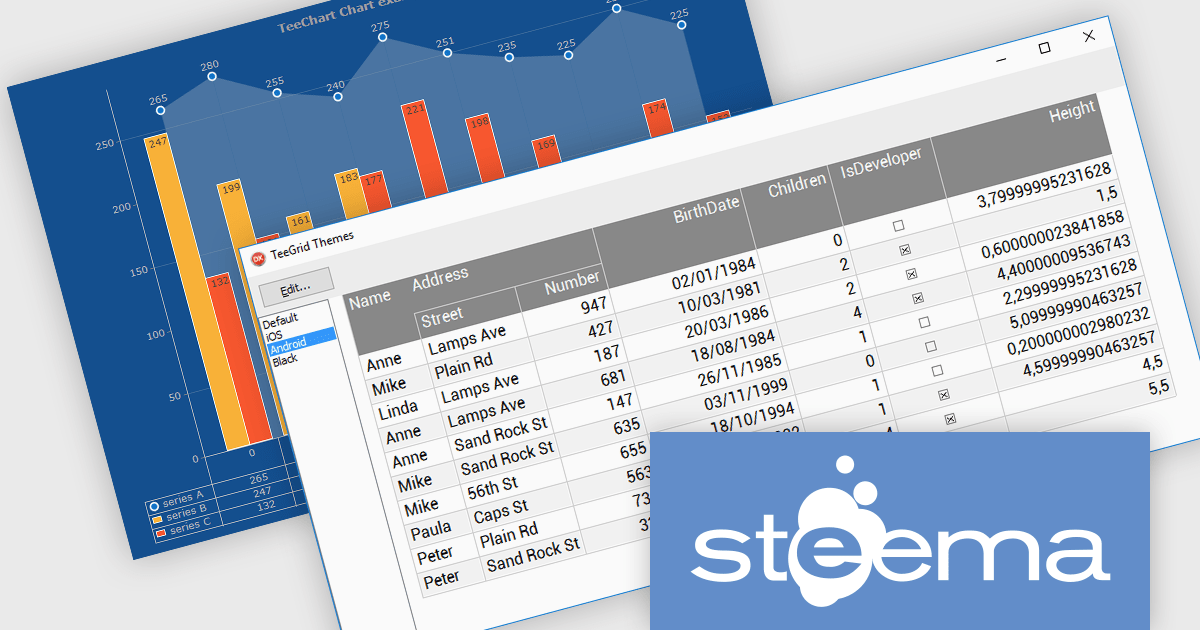
TeeChart Pro VCL/FMX is a comprehensive charting component library that empowers you to create visually stunning and informative data visualizations. With its vast array of chart types, including line, bar, pie, and scatter charts, and extensive customization options, TeeChart Pro caters to a wide spectrum of visualization needs.
TeeGrid VCL/FMX is a powerful and versatile grid component library for Delphi, C++Builder, and RAD Studio. It seamlessly handles tabular data presentation and management, offering flexible cell formatting, data binding, and extensive customization. Its lightweight and efficient nature makes TeeGrid VCL an ideal choice for a diverse array of applications.
Steema Software has announced that its TeeChart VCL 2024 (Build 2024.41.240913) and TeeGrid VCL v1.16 releases are now fully compatible with RAD Studio 12.2 Athens (Delphi and C++Builder). This release enhances the development experience by ensuring compatibility with the latest features and optimizations of Embarcadero’s IDEs. Developers can fully leverage TeeChart's comprehensive charting tools and TeeGrid's efficient data grid capabilities whilst benefiting from the performance improvements of RAD Studio 12.2. It ensures smoother workflows, better performance, and access to the latest Delphi and C++ Builder features, thus enabling developers to build modern, responsive, and visually appealing applications across multiple platforms.
Steema VCL products are licensed per developer and include a one year subscription for minor and major updates plus access to technical support. Priority support is also available. For more information see our licensing pages for TeeChart Standard VCL/FMX, TeeChart Pro VCL/FMX, TeeGrid VCL/FMX, and TeeSuite for RAD Studio.
Learn more on our Steema VCL product pages:
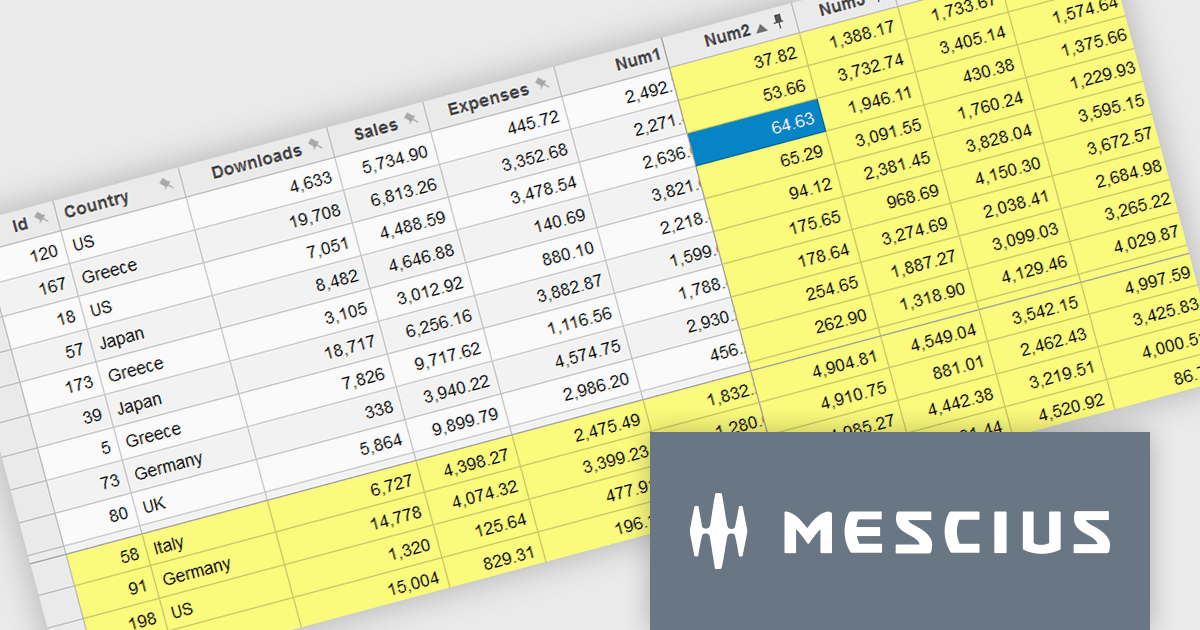
Wijmo by MESCIUS is a comprehensive JavaScript library offering a suite of high-performance UI components and data grids specifically designed to streamline the development of modern enterprise applications. It emphasizes reduced development time and improved maintainability, along with a focus on performance through its efficient design and small module size. Wijmo integrates seamlessly with popular JavaScript frameworks like Angular, React, and Vue.js, and supports cutting-edge technologies like TypeScript, making it a versatile solution for building complex web applications.
The Wijmo 2024 v2 update improves FlexGrid with the ability to freeze and pin columns to the right and rows to the bottom. Previously, freezing was limited to the left side for columns and the top for rows. Experience greater flexibility and improved data presentation with the ability to freeze cells in any direction. This feature streamlines data analysis by keeping critical rows and columns visible, enhancing usability and allowing users to focus on key information. With a more intuitive interface, users enjoy a seamless experience, leading to higher satisfaction and a more professional software tool.
To see a full list of what's new in 2024 v2 (Build 5.20242.21), see our release notes.
Wijmo is licensed per developer. Developer Licenses are perpetual and include 1 year Subscription which provides upgrades, including bug fixes and new features. See our Wijmo licensing page for full details.
Learn more on our Wijmo product page.
전화 : 00798 14 800 6332
팩스 : +1 770 250 6199


