


공식 공급 업체
200 이상의 소프트웨어 개발처와 판매 계약을 맺은 공인 디스트리뷰터로서 합법적인 라이선스를 제공합니다.
모든 브랜드 보기.
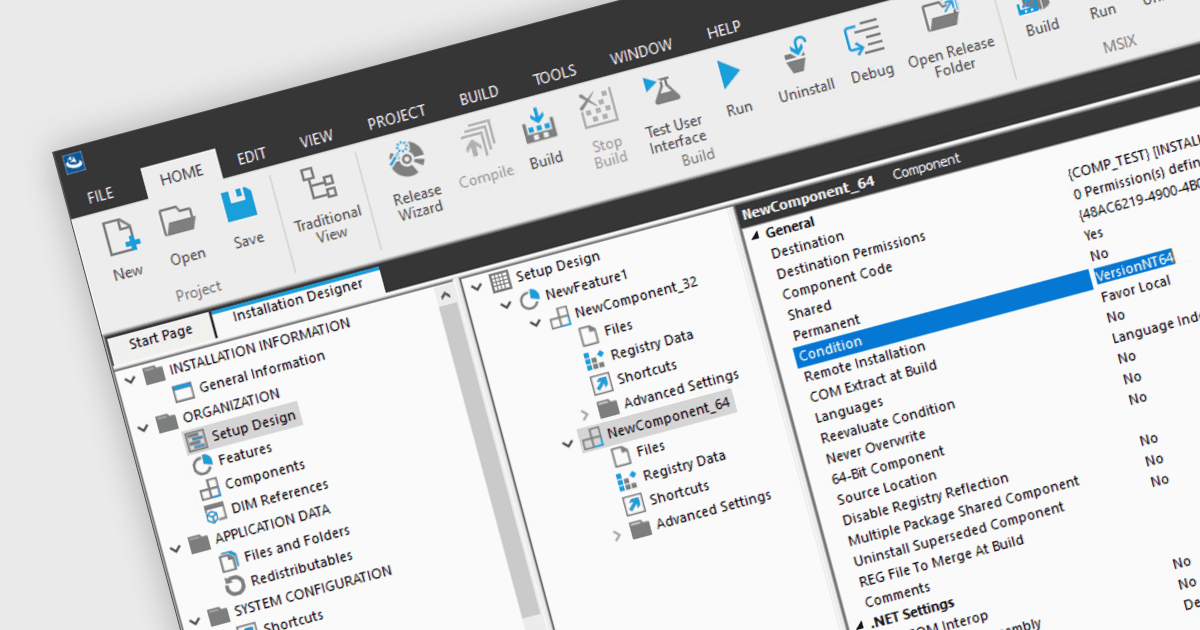
Unified 32/64-bit installers contain the necessary components for both architectures. They can automatically adapt the installation to deploy either the 32 or 64-bit version of the program depending on the target operating system. This simplifies software distribution, eliminating the need for separate installers for each architecture, ensuring compatibility across a range of systems, and providing a seamless installation experience for developers and end-users alike.
Several installation tools support the creation of unified 32/64-bit installers, including:
For an in-depth analysis of features and price, visit our Installation Tools comparison.
For the past fifteen years, ComponentSource and GigaSoft have fostered a collaborative partnership, enabling developers to build applications with professional charting and data visualization features.
GigaSoft is a prominent provider of charting and graphing components for developers, best known for its ProEssentials product line. The company has provided components to a broad customer base, including many blue chip corporations. ProEssentials can be used to create various charts including 2D and 3D charts, scientific charts, and financial charts. It offers high performance, stability, and customization, aiding developers in creating visually impactful data visualizations within their applications.
By leveraging ComponentSource's global network and unparalleled expertise in software distribution, GigaSoft has achieved an expanding customer base. The thriving partnership has consistently delivered innovative and reliable software products that meet the needs of developers and businesses around the world. GigaSoft's commitment to quality and customer satisfaction has regularly placed them in ComponentSource's Top Publisher Awards.
Learn more about GigaSoft.

Mail merge in reporting software is a feature that allows users to automatically generate letters, labels, and other documents by merging a template with data. This is typically used to create personalized documents in bulk, such as invoices, form letters, or address labels, saving time and reducing errors compared to manually entering information. Mail merge is widely used in marketing, customer service, and administrative tasks, making it a valuable asset for any organization sending bulk communications.
Several WPF Reporting controls provide Mail Merge functionality including:
For an in-depth analysis of features and price, visit our WPF Reporting Controls comparison.
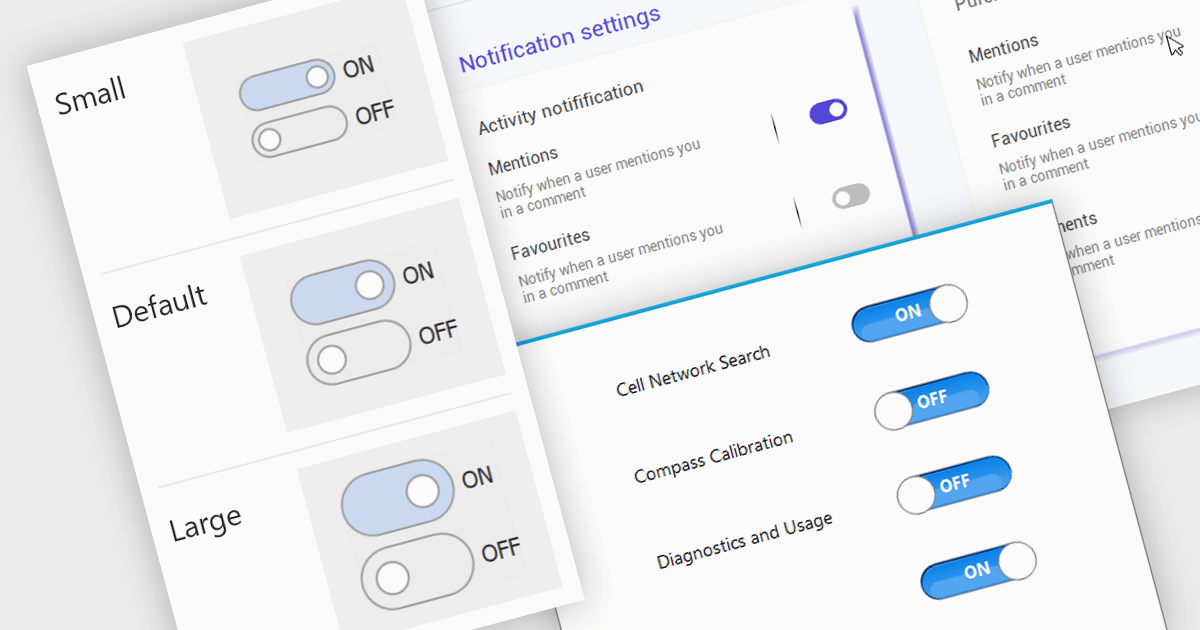
A toggle switch control is a user interface element that allows the rapid, binary (on/off) selection of a setting. It functions like a physical switch, offering a clear visual representation of the chosen state and triggering an immediate change through user interaction. Its simplicity and immediacy make it ideal for controlling settings, activating features, and toggling preferences within digital interfaces.
Several WinForms data editor collections offer toggle switch controls including:
For an in-depth analysis of features and price, visit our comparison of WinForms Data Editors.

PDF export functionality allows users to convert spreadsheets into PDF format, preserving the layout and formatting of the data. By seamlessly translating your data into a universally accessible format, you ensure colleagues, clients, and stakeholders can readily view and interpret your work without needing proprietary software. Choose from flexible options like exporting specific sheets, customizing page layouts, and enhancing accessibility for optimal visual presentation and impact. Whether for reports, invoices, or internal analyses, PDF export empowers a professional workflow with streamlined data dissemination.
Several .NET Spreadsheet components include support for exporting as PDF files, including:
For an in-depth analysis of features and price, visit our comparison of .NET Spreadsheet components.
전화 : 00798 14 800 6332
팩스 : +1 770 250 6199


