


공식 공급 업체
200 이상의 소프트웨어 개발처와 판매 계약을 맺은 공인 디스트리뷰터로서 합법적인 라이선스를 제공합니다.
모든 브랜드 보기.
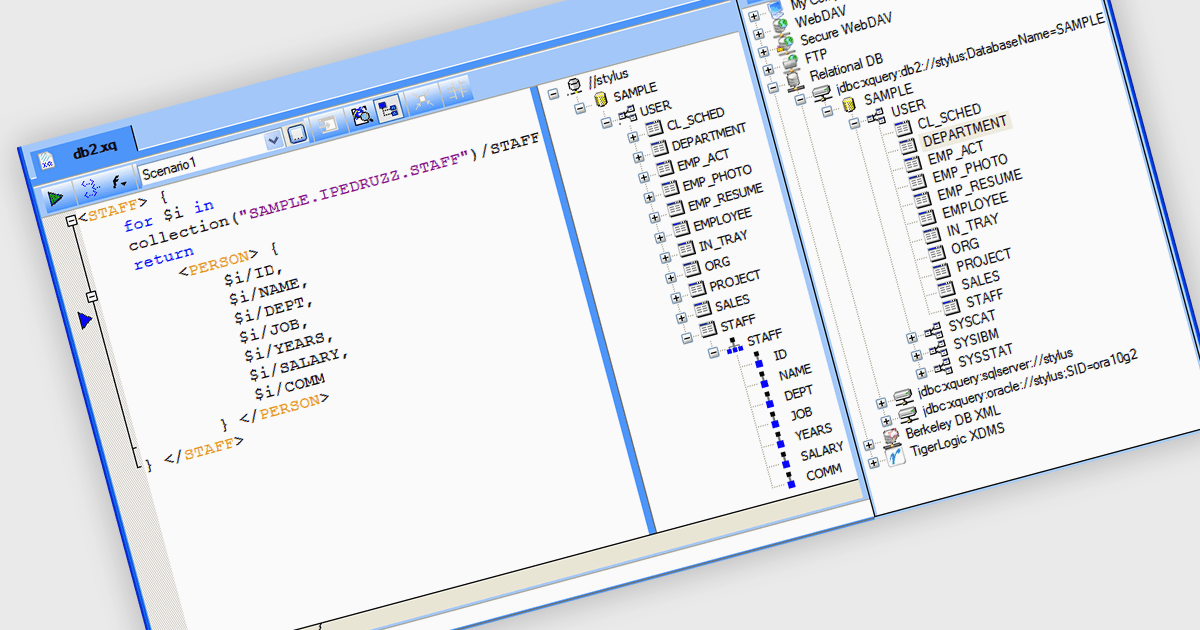
IBM DB2 database support in Structured Document Tools refers to the ability of XML and data development software to connect directly to IBM DB2 relational databases for accessing, querying, and integrating structured data within document-based processes. This support enables users to generate or validate XML and other structured documents against DB2 data, perform database-driven transformations, map DB2 content into XML schemas, and design reports or outputs based on live enterprise database information. By providing built-in connectivity to IBM DB2, these tools help organizations improve data exchange, ensure consistency between structured documents and backend systems, and support complex publishing, integration, and compliance processes in DB2-based environments.
Several structured document tools support IBM DB2 including:
For an in-depth analysis of features and price, visit our comparison of structured document tools.

AutoMapper by Lucky Penny Software is a convention-based object-to-object mapping library designed for Microsoft .NET developers. It improves the process of transforming data between objects, particularly when mapping complex domain models to simpler Data Transfer Objects (DTOs), using intelligent conventions and configuration options to minimize manual coding.
By eliminating repetitive boilerplate mapping code, AutoMapper helps developers build cleaner, more maintainable applications. It enforces consistent naming conventions, validates mappings at runtime, and optimizes LINQ projections for efficient data querying. This makes it especially valuable in layered architectures, API development, and enterprise applications where data transformation is frequent and complex. From startups to large organizations, teams use AutoMapper to reduce errors, accelerate development cycles, and focus on delivering business value rather than managing tedious object-mapping logic.
AutoMapper is licensed on an annual subscription basis per development team, with Standard (1–10 developers), Professional (11–50 developers), and Enterprise (unlimited developers) tiers. See our AutoMapper licensing page for full details.
For more information, visit our AutoMapper product page.
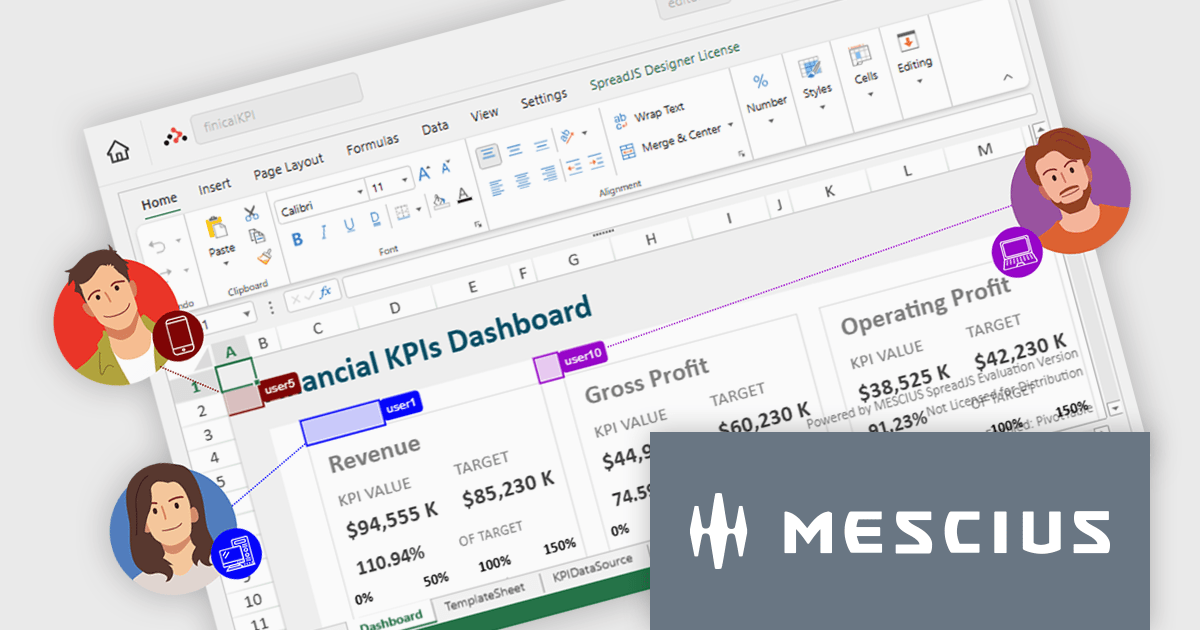
SpreadJS is a complete enterprise JavaScript spreadsheet solution used to create financial reports and dashboards, budgeting and forecasting models, scientific, engineering, healthcare, education, science lab notebooks, and other similar JavaScript business applications. It leverages a high-speed calculation engine with over 500 Excel built-in functions in 19 languages to deliver true Excel-like spreadsheet experiences with zero dependencies on Excel and full support for React, Vue, Angular, and TypeScript.
On Thursday, February 26th at 11:00 AM EST, MESCIUS (formerly GrapeCity) will be presenting a CodeClinic Live Webinar highlighting the new Collaboration Server as a production-ready solution for real-time, multi-user spreadsheet editing in enterprise JavaScript applications. During this webinar, SpreadJS Product Manager Chris Bannon and Product Marketing Manager Mackenzie Albitz will take you through the following key takeaways:
Register for the Live Webinar today and mark your calendar for February 26th.
SpreadJS is licensed per developer and includes 1 Year Maintenance (major and minor version releases and unlimited support phone calls). SpreadJS requires an Annual or Perpetual Deployment License. The optional Add-ons are available at an additional cost, and require a SpreadJS license. See our SpreadJS licensing page for full details.
For more information, visit our SpreadJS product page.
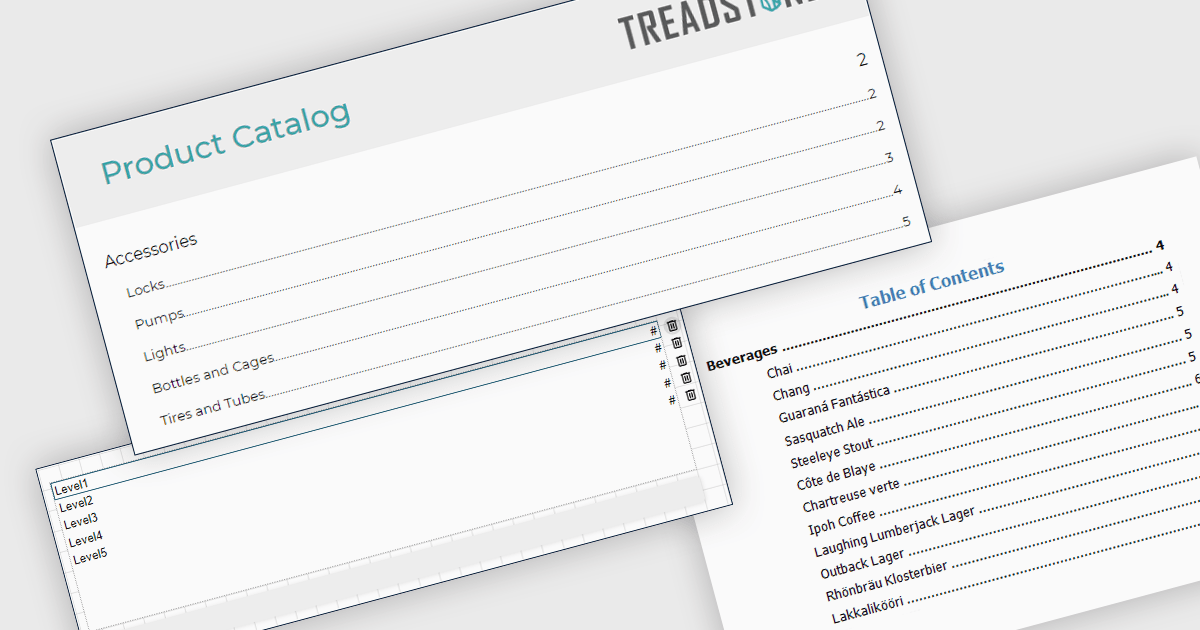
A table of contents in a report is a structured list of sections and subsections that provides an organized overview of the document's content. It typically reflects the report's hierarchy and allows readers to navigate quickly to specific sections, either through page references in printed formats or clickable links in digital formats. This functionality improves usability by reducing the time required to locate information, supporting clearer document structure, and making complex or lengthy reports easier to understand and manage. For organizations that distribute detailed analytical or operational reports, a table of contents contributes to a more professional presentation and a more efficient review process.
Several JavaScript reporting components allow you to add a table of contents, including:
For an in-depth analysis of features and price, visit our comparison of JavaScript reporting components.

Opening PDFs directly from streams in ASP.NET PDF Viewer components refers to the ability to load and render PDF documents from a .NET Stream object rather than from a physical file stored on the server. This means the PDF content can be retrieved dynamically from sources such as databases, cloud storage, web APIs, or generated in memory at runtime, and then passed directly to the viewer for display. By working with streams, applications can avoid temporary file storage, improve security by reducing file system exposure, and better support modern deployment scenarios such as containerized or cloud-based environments where local storage may be limited or transient.
Several ASP.NET Core PDF viewer components offer open PDFs from stream functionality including:
For an in-depth analysis of features and price, visit our comparison of ASP.NET Core PDF viewer components.
전화 : 00798 14 800 6332
팩스 : +1 770 250 6199


