


공식 공급 업체
200 이상의 소프트웨어 개발처와 판매 계약을 맺은 공인 디스트리뷰터로서 합법적인 라이선스를 제공합니다.
모든 브랜드 보기.
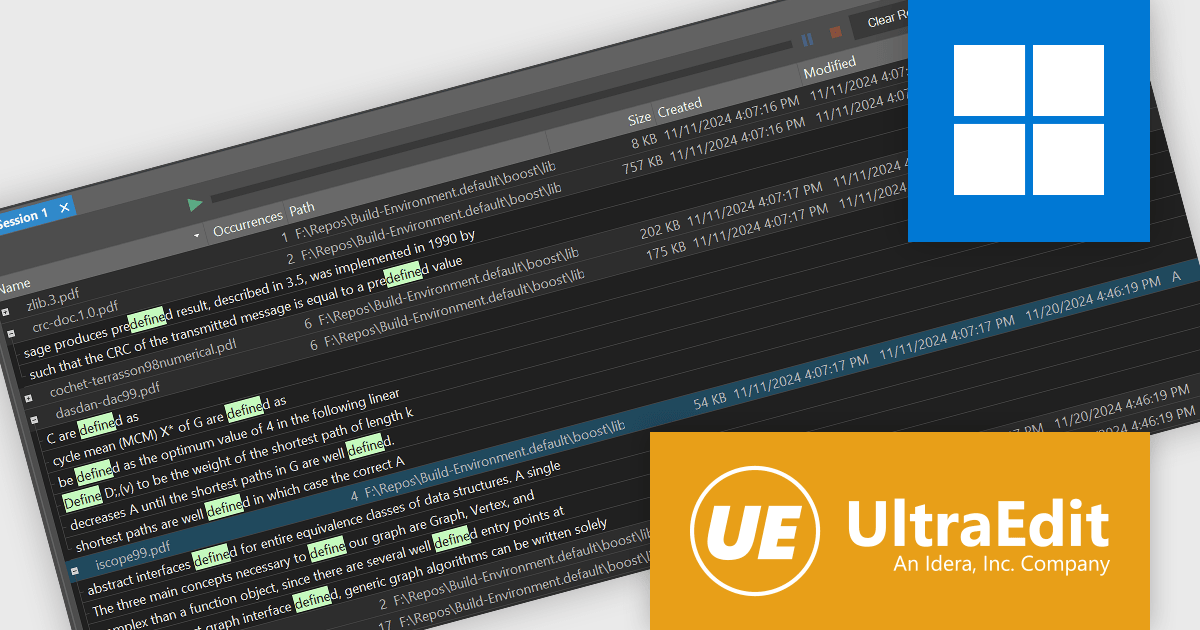
UltraFinder by UltraEdit is a powerful and lightweight Windows search utility that is designed to help users locate and manage information with precision and efficiency. It scans hard drives, network volumes, removable drives, and even FTP/SFTP servers to unearth any file, word, text string, pattern, or duplicate file with ease. It's features include lightning-fast indexing, intelligent caching for improved performance, and customizable search parameters to meet specific user needs. UltraFinder is ideal for professionals managing large volumes of files, such as developers, researchers, and business teams, providing benefits such as streamlined workflows, reduced data retrieval times, and improved organization.
The UltraFinder 2024.0 update introduces an Enhanced PDF Search feature that empowers software developers to efficiently handle a broader range of PDF file types, including image-only and scanned documents. By integrating advanced Optical Character Recognition (OCR) technology, this update enables the extraction of text from images, making it possible to search through non-standard PDFs such as scanned contracts, handwritten notes, and graphic-heavy documents. Developers can now streamline their workflows with faster, more precise search functionality, supported by text indexing and caching to optimize performance across large document libraries. This enhancement ensures that all PDF content becomes accessible and searchable, enabling seamless organization and retrieval of critical information.
To see a full list of what's new in version 2024.0, see our release notes.
UltraFinder is licensed per user, available as a perpetual named or concurrent license with one year of maintenance providing priority support and updates, or as part of UltraEdit All Access which is available as a perpetual or subscription timed license. See our UltraFinder licensing page for full details.
For more information, visit our UltraFinder product page.
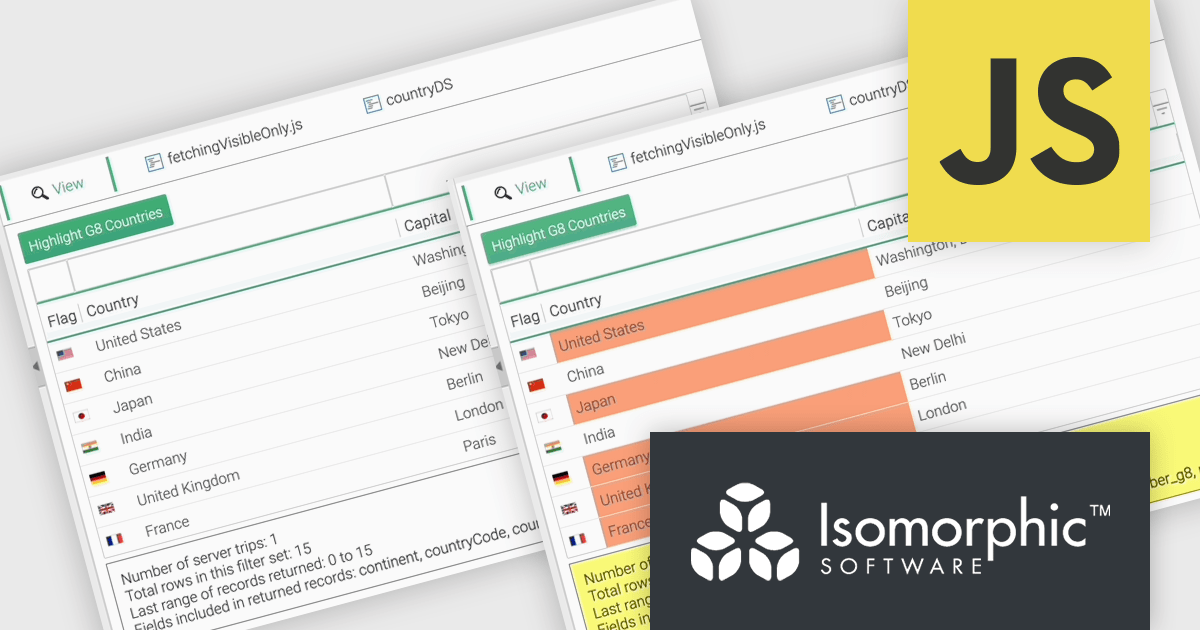
SmartClient is a comprehensive JavaScript component suite compatible with React, Vue, Angular, and more, that empowers you to craft large-scale, high-productivity Enterprise web applications. It provides a comprehensive set of tools for developers, including advanced UI components, robust data management capabilities, and seamless integration with modern backend technologies. Key features include dynamic data fetching, customizable grids, and a responsive interface for a wide range of devices. SmartClient enables developers to create applications with optimized performance, scalability, and a superior user experience. Ideal for enterprise-grade use cases, such as financial analytics, inventory management, and real-time reporting, SmartClient empowers organizations to deliver feature-rich applications that handle complex data requirements with ease.
The SmartClient 13.1 update introduces the Fetch Only Needed Data feature, enabling developers to optimize performance in data-intensive applications by dynamically retrieving only the fields required at a given moment. This targeted data retrieval reduces unnecessary data transfers, minimizes backend load, and enhances responsiveness. Developers can configure grids to fetch additional fields on demand, ensuring efficient resource usage while maintaining flexibility to adapt to dynamic application requirements. By integrating this feature, applications can scale effectively, provide a smoother user experience, and meet the demands of high-performance environments.
To see a full list of what’s new in version 13.1, see our release notes.
SmartClient is licensed per developer and is available as both perpetual and subscription licenses. Product updates and technical support is also available. See our SmartClient licensing page for full details.
For more information, visit our SmartClient product page.
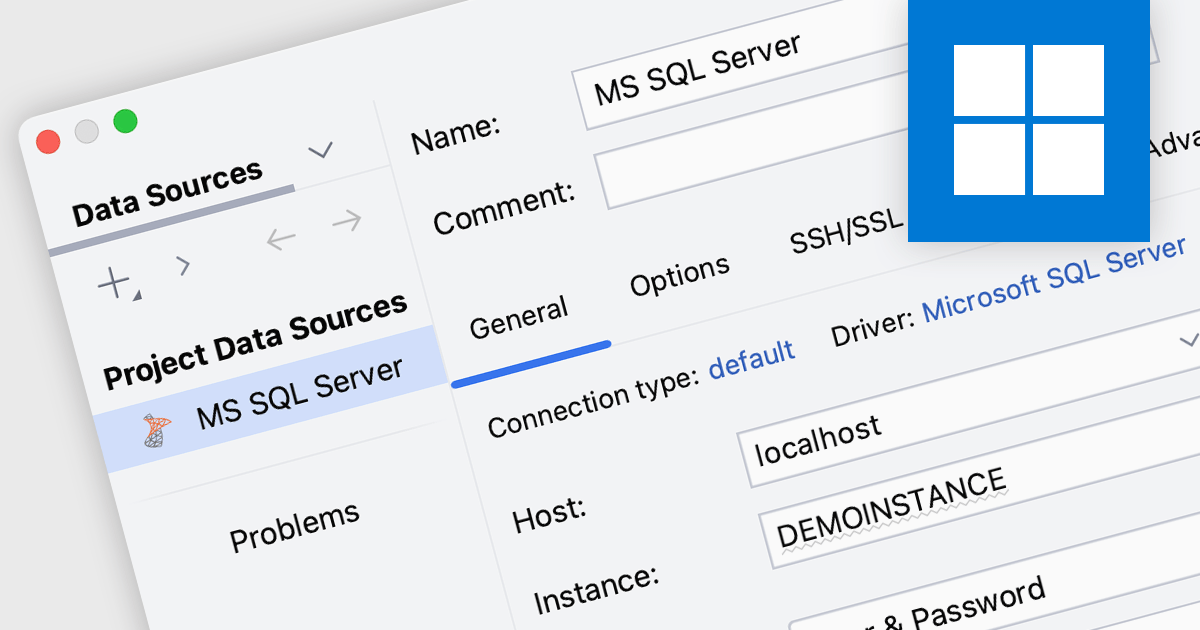
SQL Server connectivity in integrated development environments (IDEs) allows developers to connect directly to an SQL Server database, enabling them to execute queries, manage data, and interact with database objects like tables and stored procedures within the IDE. This integration streamlines workflows by reducing the need to switch tools, enhances productivity with features like autocomplete and syntax highlighting, and supports better collaboration and database management through visual tools and intuitive interfaces. It also simplifies debugging, testing, and schema visualization, making development more efficient.
Many integrated development environments (IDEs) offer SQL Server connectivity including:
For an in-depth analysis of features and price, visit our comparison of IDEs.

ComponentSource and Softbuilder have enjoyed a successful five year partnership focused on delivering high-quality database management and data modeling solutions to the global developer community. This enduring collaboration highlights their mutual dedication to equipping developers with tools that boost productivity and simplify workflows.
Softbuilder is a software development company that provides cutting-edge tools designed to streamline database management, enhance data modeling, and optimize the handling of complex metadata. With a focus on delivering user-friendly, efficient, and innovative solutions, the company serves a wide range of industries and technical needs. Its products empower professionals to improve workflows, maintain data integrity, and meet the demands of modern database systems with precision and reliability. By combining expertise with a commitment to quality, Softbuilder stands out as a trusted partner for businesses seeking to elevate their data-driven operations.
ComponentSource, a leading distributor of software components and development tools, has played a crucial role in expanding the reach of the Softbuilder range. Through this partnership, ComponentSource has helped make AbstraLinx, ERBuilder Data Modeler, and other Softbuilder products accessible to a broader audience of developers.
The enduring collaboration between ComponentSource and Softbuilder has had a positive impact on the developer community by making powerful database and data modeling tools more accessible. As we celebrate this five year partnership, we look forward to strengthening our relationship and continuing to provide developers worldwide with reliable, innovative solutions that enhance their workflows.
Learn more about Softbuilder.
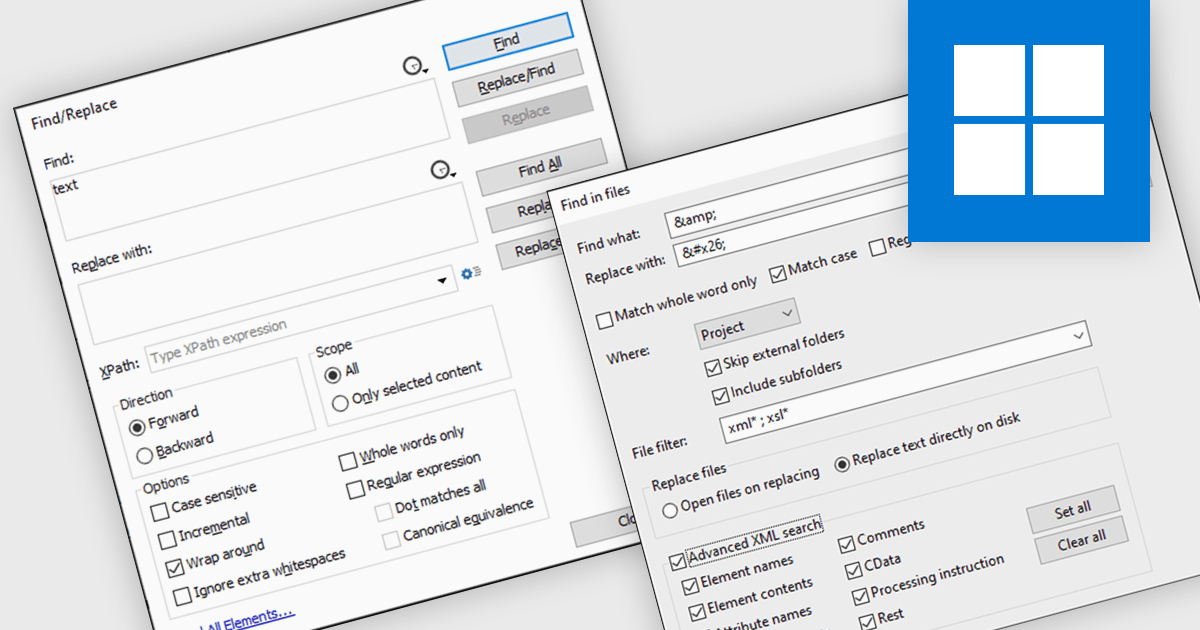
Find and replace functionality in XML tools allows users to efficiently locate specific elements, attributes, or values within XML documents and modify them in bulk with precision. This feature is invaluable for maintaining consistency, updating outdated content, or correcting errors across large or complex XML files. By automating repetitive tasks, it saves time, reduces the likelihood of manual errors, and enhances productivity. Common use cases include updating metadata, restructuring tags, or applying global changes to data schemas. Whether managing extensive content libraries or refining XML for data exchange, find and replace is an essential tool for streamlining workflows and ensuring accuracy.
Several structured document tools offer find and replace including:
For an in-depth analysis of features and price, visit our structured document tools comparison.
전화 : 00798 14 800 6332
팩스 : +1 770 250 6199


