


공식 공급 업체
200 이상의 소프트웨어 개발처와 판매 계약을 맺은 공인 디스트리뷰터로서 합법적인 라이선스를 제공합니다.
모든 브랜드 보기.
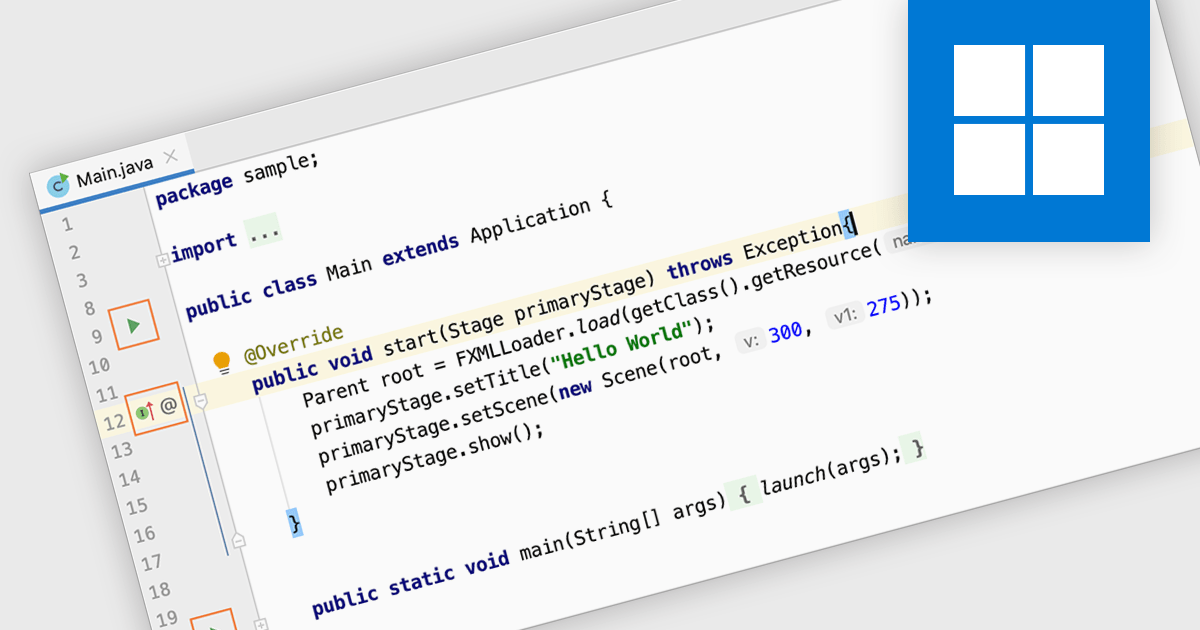
Code editing in an IDE goes beyond basic text editing by offering intelligent features specifically tailored to programmers. Syntax highlighting, autocompletion, and code navigation tools streamline the writing process, while debugging and build automation functionalities within the IDE help you identify and fix errors efficiently, all within a single, consolidated environment. This integrated approach significantly improves development workflow and productivity.
Several IDEs provide code editing including:
For an in-depth analysis of features and price, visit our IDEs comparison.
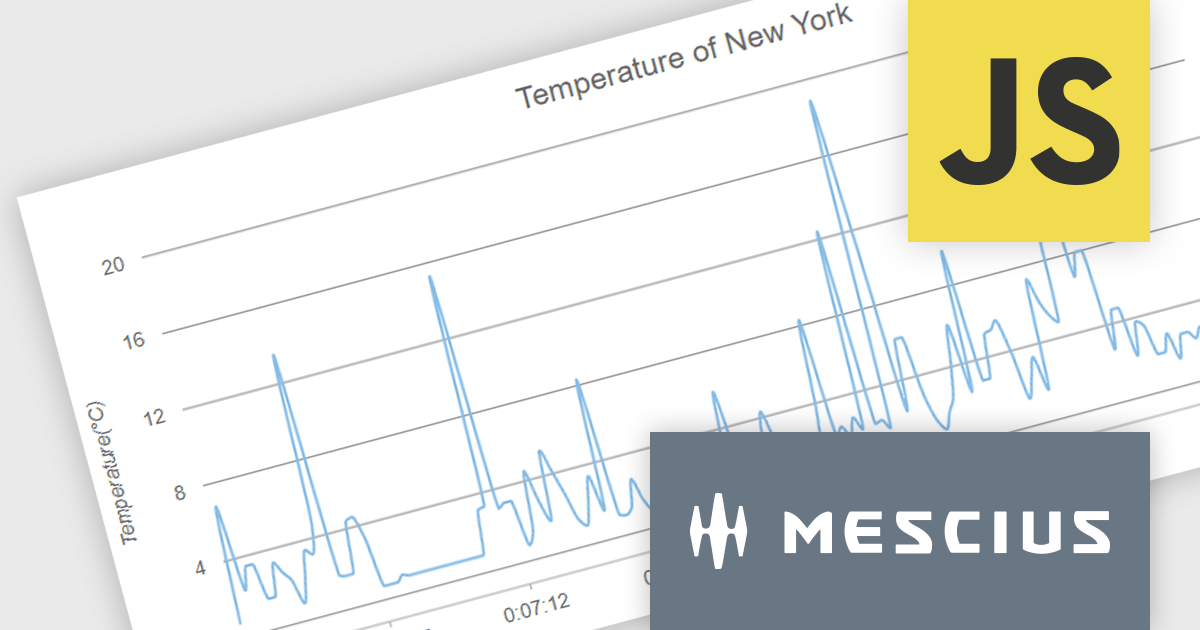
Wijmo by MESCIUS is a comprehensive suite of JavaScript UI controls for building interactive web applications. It offers a wide range of powerful components including grids, charts, inputs, and gauges, designed to streamline development processes and enhance user experiences. With its robust functionality and customizable features, Wijmo simplifies the creation of sophisticated web interfaces, empowering software developers to efficiently craft responsive and visually appealing applications without sacrificing performance or scalability.
The Wijmo 2024 v1 release includes significant rendering refinements for FlexChart and FlexPie. Notable improvements include smoother rounding for polylines and polygons in FlexChart, enhanced spline chart interpolation, and refined tooltips tailored specifically for small slices within FlexPie. These updates collectively enhance the visual quality, precision, and user experience of both chart components, providing developers with finer control over chart aesthetics and data representation.
To see a full list of what's new in 2024 v1, see our release notes.
Wijmo is licensed per developer. Developer Licenses are perpetual and include 1 year Subscription which provides upgrades, including bug fixes and new features. See our Wijmo licensing page for full details.
For more information, visit our Wijmo product page.
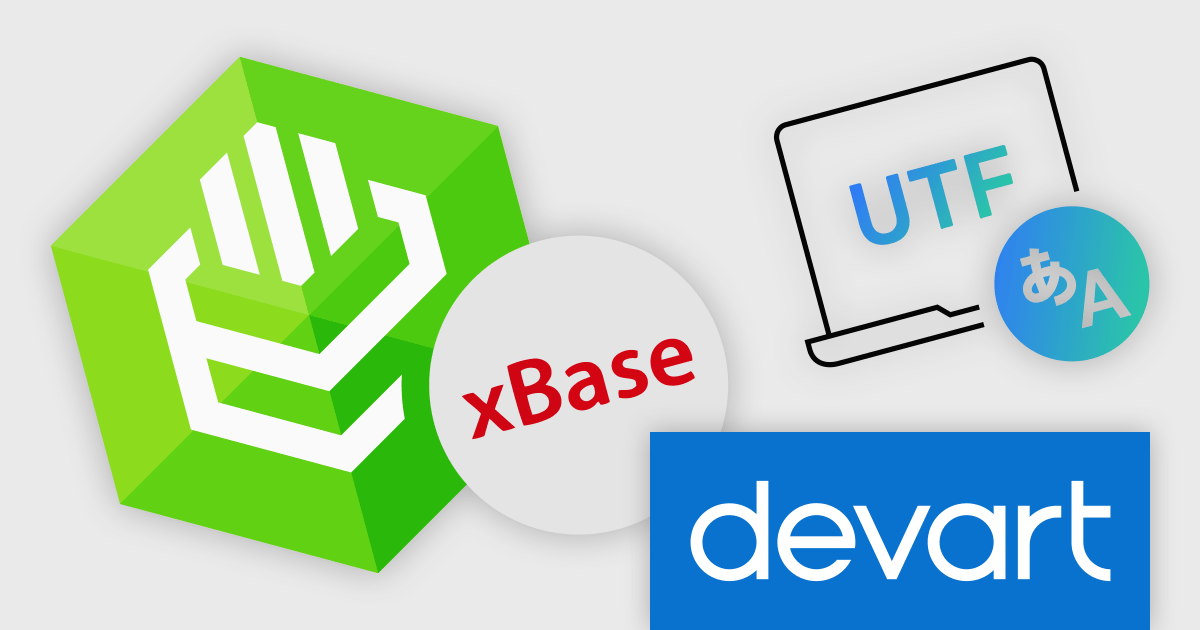
Devart ODBC Driver for xBase empowers ODBC-compliant applications like reporting tools and Business Intelligence (BI) software to access data stored in xBase formats, commonly used by FoxPro and dBase databases. This driver provides a high-performance and secure connection, enabling applications on Windows, macOS, and Linux to interact directly with xBase data for tasks like reporting and analysis. It simplifies integration by offering full support for standard ODBC functionalities and data types.
Version 5.0.0 adds support for UTF-8 encoding, enabling you to work with xBase databases containing characters from a wider range of languages, including those with special characters. This eliminates data corruption concerns and simplifies handling multilingual data within your xBase environment.
To see a full list of what's new in 5.0.0, see our release notes.
Devart ODBC Driver for xBase is licensed per developer and is available as an Annual or Perpetual License with a 12 month support and maintenance subscription. See our Devart ODBC Driver for xBase licensing page for full details.
Devart ODBC Driver for xBase is available in the following products:

HttpWatch by Neumetrix is a powerful HTTP traffic monitoring tool designed to assist software developers in analyzing and optimizing web applications. It provides detailed insights into HTTP traffic between a web browser and web server, offering real-time metrics such as response times, headers, cookies, and content. With its user-friendly interface and advanced features like timeline visualizations and performance metrics, HttpWatch facilitates efficient debugging, performance tuning, and troubleshooting of web applications, ultimately aiding developers in delivering faster and more reliable user experiences.
HttpWatch v15 introduces a valuable feature allowing developers to view a list of cookies blocked by the browser along with the specific reasons for their blockage. This enhancement significantly streamlines the debugging process by providing clear insights into why certain cookies are being blocked, empowering developers to swiftly address issues related to cookie management and ensure seamless functionality within their web applications. By offering explanations for cookie blockages, developers can efficiently troubleshoot and adjust their code to ensure proper cookie handling, thereby enhancing the overall reliability and performance of their web applications.
To see a full list of what's new in v15, see our release notes.
HttpWatch is licensed per user and is available as Single User, 4 Team, 10 Team, Site (Single Location), or Enterprise (Single Organization, Multiple Locations). See our HttpWatch licensing page for full details.
Learn more on our HttpWatch product page.
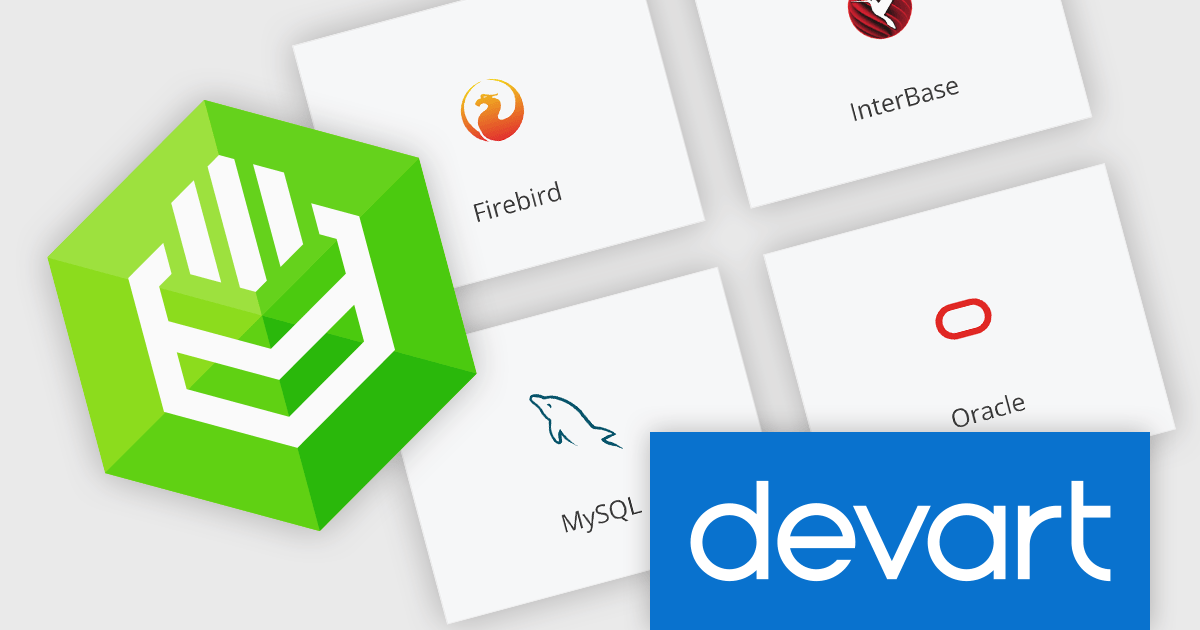
Devart's ODBC Drivers bridge the gap between various databases and ODBC-compliant applications like reporting tools and analytics software. They provide secure, high-performance connections for accessing data from popular databases like SQL Server and Oracle on Windows, macOS, and Linux. Devart's drivers boast extensive functionality, allowing you to leverage features like stored procedures and data encryption for a seamless data transfer experience.
The latest updates to the Devart ODBC Drivers for Firebird, InterBase, MySQL, and Oracle add a new read-only mode to enhance data security by restricting users from accidentally or intentionally modifying database content. This is particularly beneficial for scenarios involving shared access to databases, ensuring data integrity for reporting, analytics, and other non-administrative tasks.
To see a full list of what's new in this latest release, see our release notes.
Devart ODBC Drivers are licensed per developer and are available as an Annual or Perpetual License with a 12 month support and maintenance subscription. See our Devart ODBC Driver Universal Bundle licensing page.
The new read-only mode is available in Devart ODBC Drivers for Firebird, InterBase, MySQL, and Oracle.
Devart ODBC Driver Universal Bundle includes all Devart ODBC Drivers in one package.
전화 : 00798 14 800 6332
팩스 : +1 770 250 6199


