


공식 공급 업체
200 이상의 소프트웨어 개발처와 판매 계약을 맺은 공인 디스트리뷰터로서 합법적인 라이선스를 제공합니다.
모든 브랜드 보기.
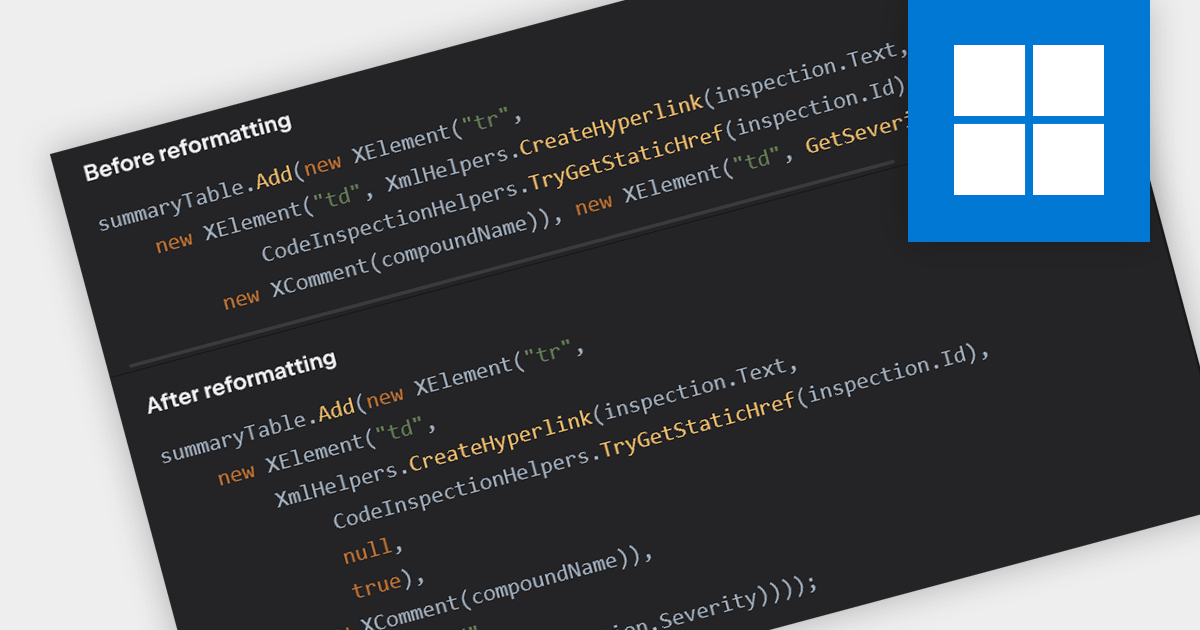
Consistent code formatting makes code clearer and easier to understand, allowing teams to focus on function rather than fighting inconsistencies. Many IDEs enhance productivity by offering auto-formatting, saving time, preventing indentation issues and highlighting syntax errors as you type. This leads to a more robust codebase, ready for version control with clear diffs and minimized merge conflicts. Beyond individual developers, formatting empowers the entire team through streamlined code reviews and improved communication.
Several IDEs incorporate code formatting features including:
For an in-depth analysis of features and price, visit our IDEs comparison.
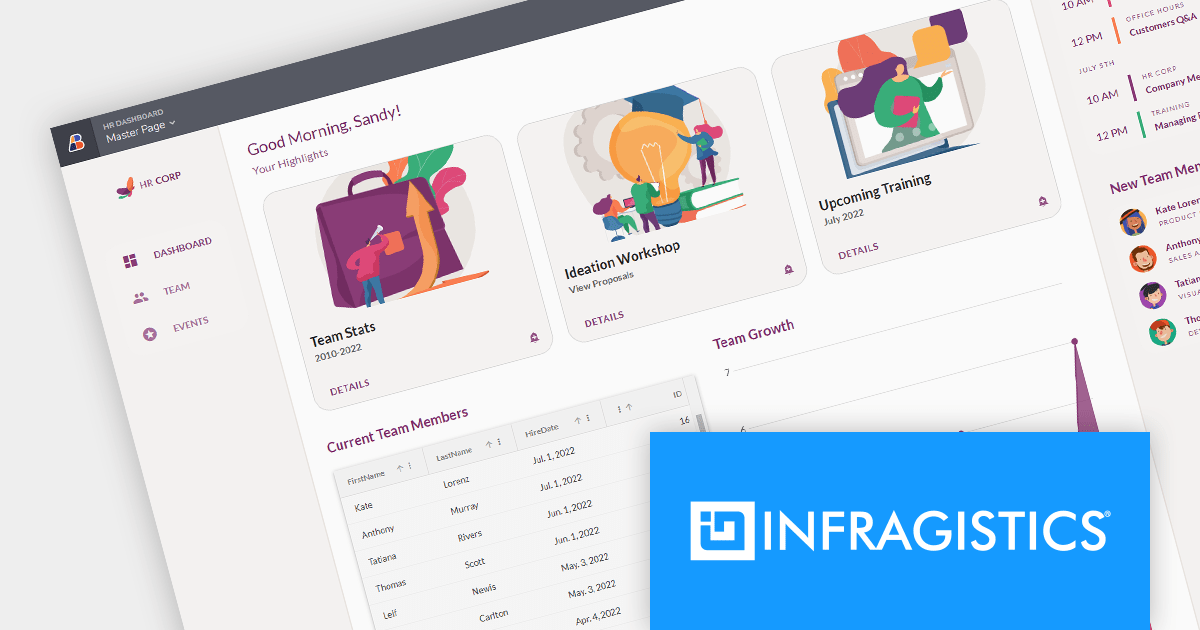
Infragistics App Builder is a new cloud-based tool that helps designers and developers build modern web apps faster. It acts as a bridge between design and code, letting you drag-and-drop UI components and generate production-ready Angular or Blazor code instantly. This eliminates the need for hand-coding layouts and saves time, allowing you to iterate on designs quickly and get feedback sooner. App Builder is a visual development platform that includes a toolbox of 60+ UI controls to turn your ideas into pixel-perfect apps without the coding headache.
Infragistics App Builder is licensed per user as a commercial annual subscription. It is available as Cloud and On Premise solutions. See our Infragistics App Builder licensing page for full details.
For more information, visit our Infragistics App Builder product page.

Data dissemination often requires flexibility and accessibility. Exporting reports to DOCX format serves this need by seamlessly translating the insights gleaned from your report into a familiar, editable document. This format preserves the structural integrity and visual aesthetic of your report while leveraging the ubiquitous editing capabilities of Microsoft Word. This dual benefit makes DOCX export ideal for several scenarios: disseminating reports to diverse audiences, seamlessly integrating reports into larger documents, and ensuring both data clarity and professional presentation. It essentially establishes a bridge between the structure of reporting tools and the adaptable environment of Word documents, empowering you to share your findings with maximum impact and ease.
Several ASP.NET Core reporting components allow you to export to DOCX format, including:
For an in-depth analysis of features and price, visit our comparison of ASP.NET Core reporting controls.

Data filtering and grouping are key spreadsheet features that allow users to manage and analyze large datasets efficiently. Filtering enables users to hide data that does not meet certain criteria, making it easier to focus on relevant information. Grouping clusters related data together, which can then be summarized with functions such as sum, average, and count. These features are vital for working with extensive spreadsheets, enabling users to simplify their view, and gain insights from specific subsets of data.
Several Angular Spreadsheet components provide data filtering and grouping support including:
For an in-depth analysis of features and price, visit our Angular Spreadsheet Component comparison.
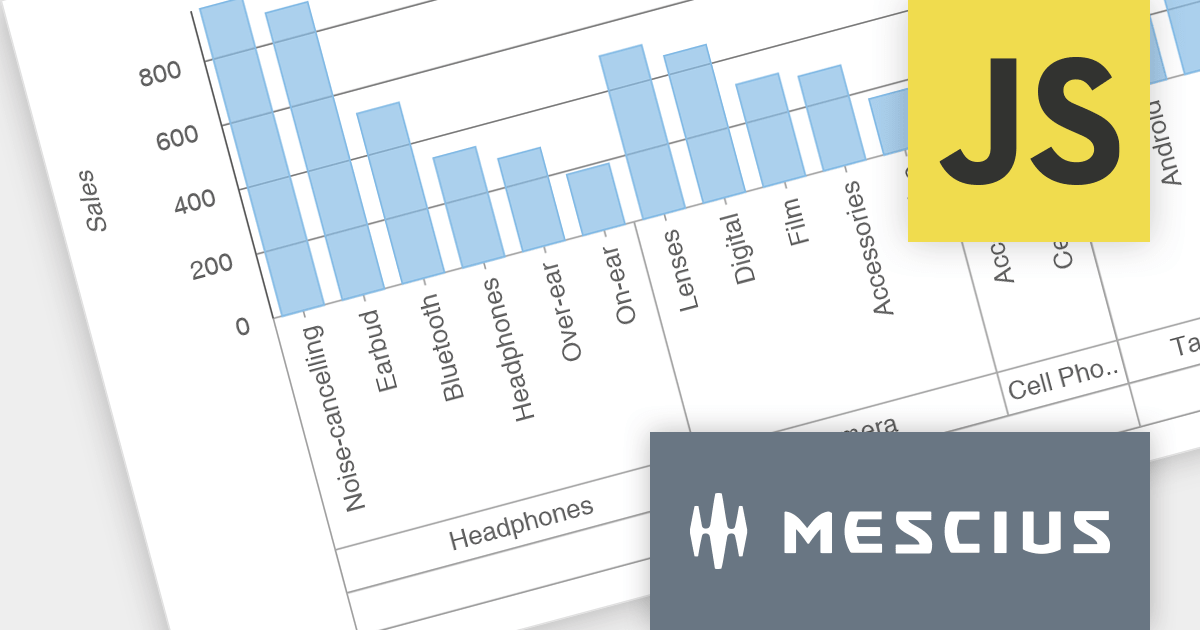
Wijmo is a cross-platform UI JavaScript library that offers a comprehensive set of controls and tools for building rich, interactive web applications. Its components have zero dependencies and are written as lean TypeScript classes. Wijmo's key components include FlexGrid for data management, FlexChart for charting and data visualization, Input Controls for user input, and Report Viewer for creating and presenting reports.
The Wijmo 2023 v2 release brings data grouping support to FlexChart. Axis grouping helps to organize complex data by visually separating it into categories or subcategories along the axis, making it easier to identify trends, patterns, and outliers within each group. While data grouping has long been a staple of Wijmo's CollectionView, users requested similar functionality in FlexChart, which MESCIUS has now incorporated. You can bind FlexChart to a grouped CollectionView and set the 'axis.groupsOptions' property to enable grouped labels in your charts.
To see a full list of what's new in version 2023 v2, see our release notes.
Wijmo is licensed per developer. Developer Licenses are perpetual and include 1 year Subscription which provides upgrades, including bug fixes and new features. See our Wijmo licensing page for full details.
For more information, visit our Wijmo product page.
전화 : 00798 14 800 6332
팩스 : +1 770 250 6199


