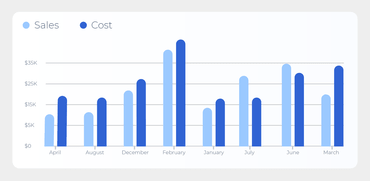
막대형, 묶은(clustered) 세로 막대형 및 Gantt를 포함한 차트에서 그래픽 요소를 회전하는 기능을 추가합니다.
3월 22, 2022
신규 버전
기능
QR Code Visual Design - Define the color and shape of various graphic elements using properties in the component editor.
New Pictorial Stacked Chart Type for reports or Dashboards - This chart is used to display the relative share of a value in the overall indicator. Any icon from the list can be presented as a graphical chart element.
Rounding in Charts - The previous release added the ability to round borders of components in Dashboards. Now you can round graphical elements in charts including bars, clustered columns, and Gantt.
Publish Wizard - This release adds the ability to use a rendered report in mdc format instead of a report template in mrt format when viewing or export a project. Also, you can now display export settings for a selected platform in the project code.