
Stimulsoft Ultimate
응용 프로그램에서 보고서 및 Dashboards를 렌더링합니다.
Stimulsoft사에서 공개
2008년 부터 ComponentSource에서 판매중
응용 프로그램에서 보고서 및 Dashboards를 렌더링합니다.
Stimulsoft사에서 공개
2008년 부터 ComponentSource에서 판매중
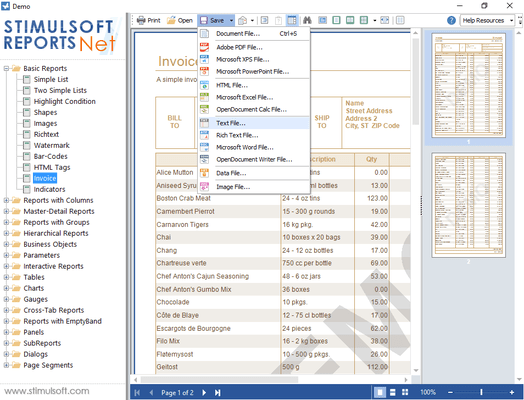
Stimulsoft Reports.Ultimate has been renamed and is now called Stimulsoft Ultimate.
Released: Oct 28, 2020
전화 : 00798 14 800 6332
팩스 : +1 770 250 6199


