컴포넌트 / Vizuly / Newtone

  1. $$$$ | 구입

    설명: Add image-processing and scanning functions to your WPF applications. ImageKit WPF lets you add image-processing functionality to your WPF applications quickly and easily. Retrieve and manipulate images from TWAIN scan devices, including document scanners ... 더 읽기

  2. $$$$ | 구입

    릴리스 노트: Added functionality to reduce the margin of the display range per cell in the Thumbnail feature. The CellSmallMargin property has been added to the Thumbnail class. Fixed an issue in the File feature where the Filetype of compressed BMP and progressive ... 더 읽기

  3. 릴리스 노트: C++Builder/Delphi 11 Alexandria are now compiled using Update 3 (11.3). Fixed a problem using custom style settings in MDIChild forms. 0 ... 더 읽기

  4. $$$$$ | 구입

    릴리스 노트: Added support for Embarcadero C++Builder 12 Athens/Delphi 12 Athens. C++Builder/Delphi 11 Alexandria are now compiled using Update 3 (11.3). When scrolling the ImageKit control in actual size display, the screen would sometimes would flicker. 0 ... 더 읽기

  5. $ | 구입

    릴리스 노트: Adds support for Microsoft.NET 7.0. ResizeKit2.NET X Added support for Microsoft.NET 8.0. 0 ... 더 읽기

  6. $ | 구입

    설명: 응용 프로그램에 사이즈 및 해상도 독립성을 제공합니다. ResizeKit ActiveX automatically changes the size of all controls and fonts so they will be displayed on any sized form. Full control is provided to customize the resizing process. Even if the user switches the size of the ... 더 읽기

  7. $$$ | 구입

    설명: Add charts and visualizations to your JavaScript apps. Vizuly Professional includes Corona, Halo, Radial Bar, Ring Chart, Weighted Tree, Geo Plot, Bar Chart, Column Chart, Line Area Chart, Radar Chart, Radial Progress, Scatter Plot, Sunburst, Tree Map, ... 더 읽기

  8. $ | 구입

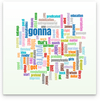
    설명: Add Word Clouds to your JavaScript apps. Vizuly Word Cloud is a unique way to represent the occurrence rate of words within a given text stream. This visualization supports an exclusion list that will ignore common pronouns, profanity, or any words you ... 더 읽기

  9. $ | 구입

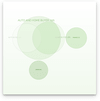
    설명: Add Venn Diagram charts to your JavaScript apps. Vizuly Venn Diagram shows all possible logical relations between a finite collection of different sets. This chart depicts elements as points in the plane, and sets as regions inside closed curves. A Venn ... 더 읽기

  10. $ | 구입

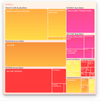
    설명: Add Tree Map charts to your JavaScript apps. Vizuly Tree Map visualizes hierarchical data in nested rectangular plots where the area of each rectangle is bound to a data property you can set. This TreeMap also supports the ability to drill down/up, in ... 더 읽기