


Fornecedor oficial
Como distribuidores oficiais e autorizados, nós fornecemos licenças legítimas diretamente de mais de 200 editores de software.
Ver todas as nossas marcas.
Continuar leitura em inglês:
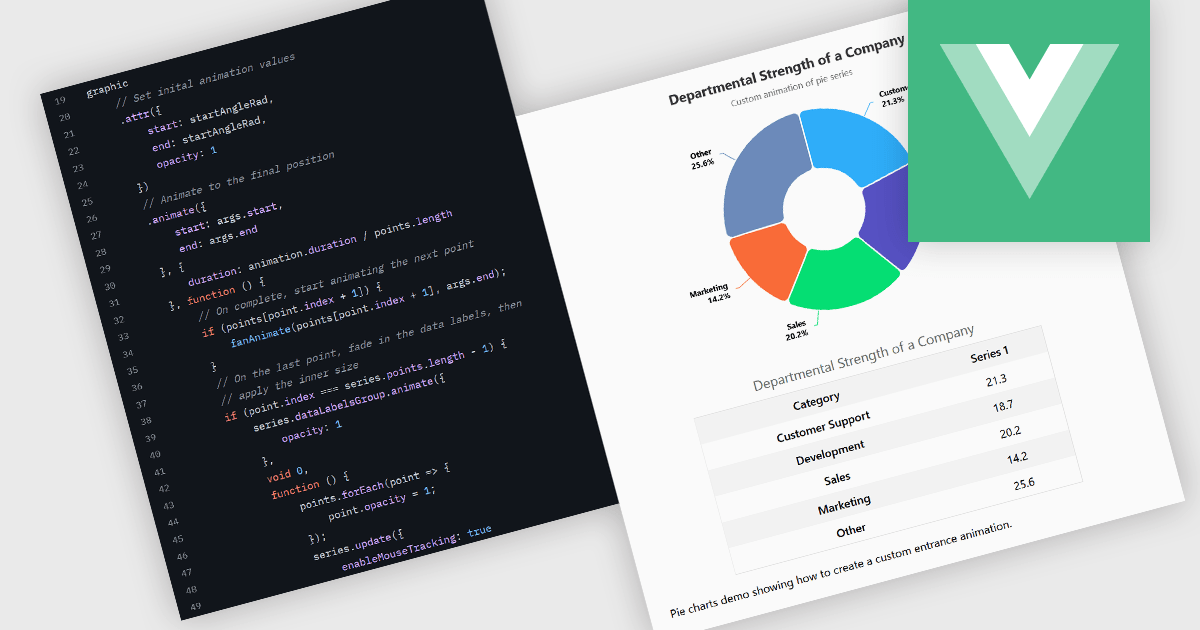
Animation in charts is a feature used in data visualization to visually transition between different data states or configurations. This technique helps communicate changes in data over time or between user interactions in a smooth, progressive manner. Rather than instantly switching from one state to another, animation introduces motion that can guide users’ attention, reinforce patterns, and reduce confusion. It is particularly useful in interactive dashboards and real-time analytics, where users benefit from a clearer understanding of what has changed and how.
Several Vue.js charting components support the use of animations, including:
For an in-depth analysis of features and price, visit our comparison of Vue.js chart components.
Tel: (888) 850 9911
Fax: +1 770 250 6199


