


Fornecedor oficial
Como distribuidores oficiais e autorizados, nós fornecemos licenças legítimas diretamente de mais de 200 editores de software.
Ver todas as nossas marcas.
Continuar leitura em inglês:
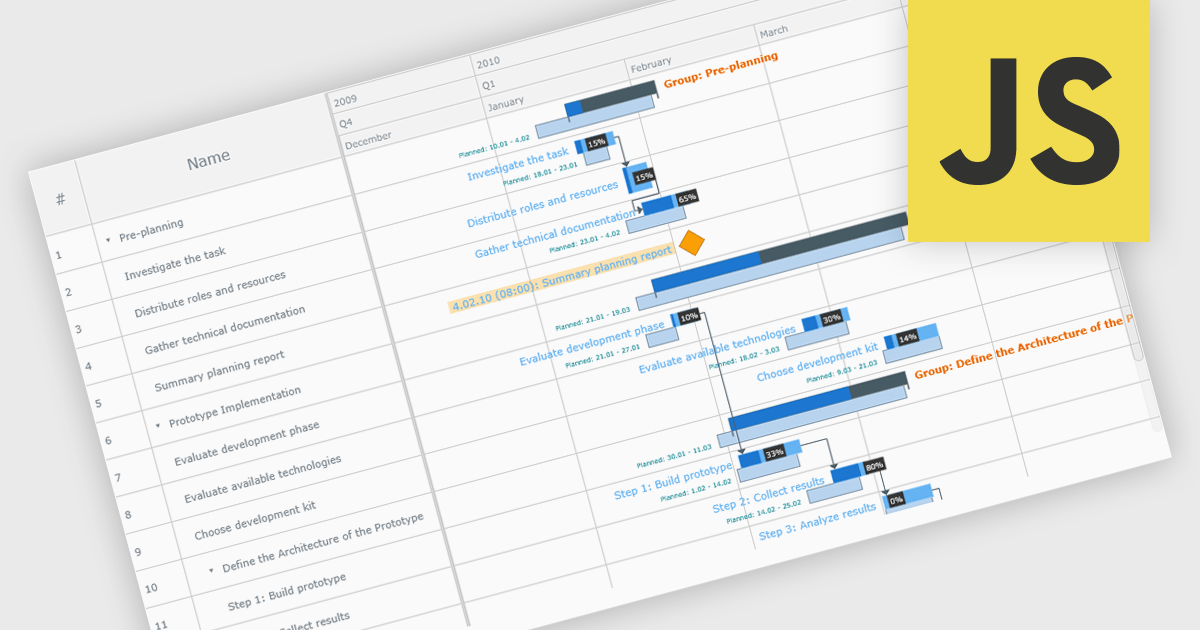
A Gantt chart is a visual project management tool that displays tasks or activities along a timeline, allowing teams to see the start and end dates, duration, and dependencies of each task within a project. Typically represented as horizontal bars across a calendar-based axis, Gantt charts provide a clear overview of project progress and help identify potential bottlenecks or scheduling conflicts. Gantt charts improve planning, scheduling, team coordination, and stakeholder transparency by clearly organizing tasks and timelines. They are especially valuable in complex projects, offering both macro and micro views to support informed decision-making and efficient execution.
Several JavaScript chart controls provide Gantt charts including:
For an in-depth analysis of features and price, visit our JavaScript chart controls comparison.
Tel: (888) 850 9911
Fax: +1 770 250 6199


