


Fornecedor oficial
Como distribuidores oficiais e autorizados, nós fornecemos licenças legítimas diretamente de mais de 200 editores de software.
Ver todas as nossas marcas.
Continuar leitura em inglês:
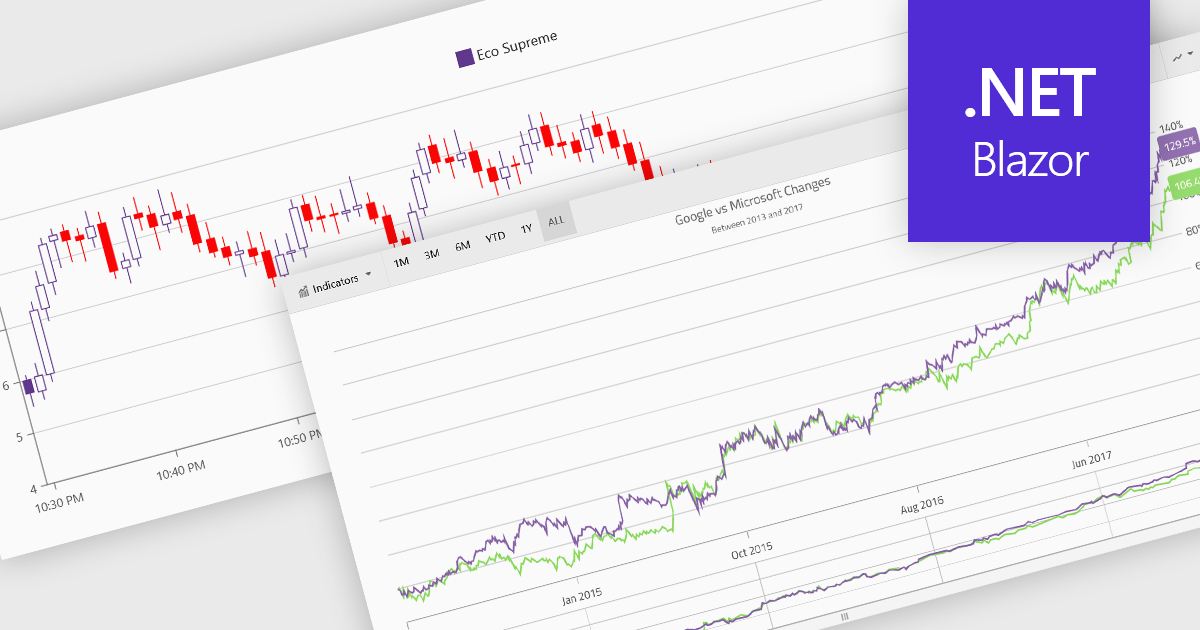
Financial charts are specialized visualizations designed to represent market data and price movements over time. Commonly used in trading platforms and analytical applications, these charts help users interpret open, high, low, and close values, as well as trends and volatility. By providing standardized financial visualizations, charting components enable developers to deliver tools that support technical analysis, decision-making, and real-time data exploration in finance-focused applications.
Common features include:
For an in-depth analysis of features and price, visit our Blazor charts components comparison.
Tel: (888) 850 9911
Fax: +1 770 250 6199


