













Fornecedor oficial
Como distribuidores oficiais e autorizados, nós fornecemos licenças legítimas diretamente de mais de 200 editores de software.
Ver todas as nossas marcas.
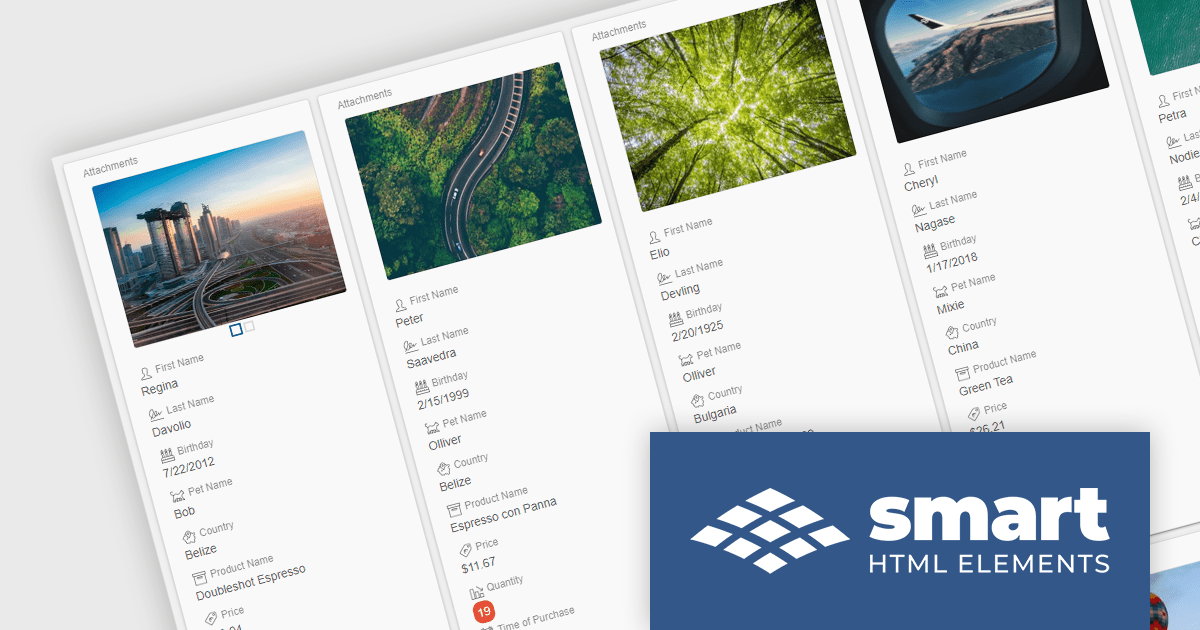
Smart HTML Elements is an enterprise-grade UI library offering pre-built web components for developers in Angular, React, Vue, Blazor, and JavaScript. It boasts over 60 ready-to-use components like grids, charts, schedulers, and editors, all featuring two-way data binding, responsiveness, accessibility, and theming capabilities. This library helps developers rapidly build dynamic and modern web applications with consistent look-and-feel and rich functionalities, accelerating development time and ensuring professional quality.
The Smart HTML Elements v18.0.0 release adds a new grid card view layout that leverages CSS grid to offer an adaptive container for presenting information in a visually appealing card format. Cards can be dynamically populated with text, images, and other multimedia elements, allowing for customization and adaptation to diverse content types. The responsive layout automatically adjusts to various screen sizes and device orientations, ensuring optimal card arrangement and user experience across platforms.
To see a full list of what's new in v18.0.0, see our release notes.
Smart HTML Elements is licensed per developer and is available as a Perpetual license with 1 year support and maintenance. It includes distribution to Unlimited Web applications, SaaS projects, Intranets and Websites. See our Smart HTML Elements licensing page for full details.
Learn more on our Smart HTML Elements product page.
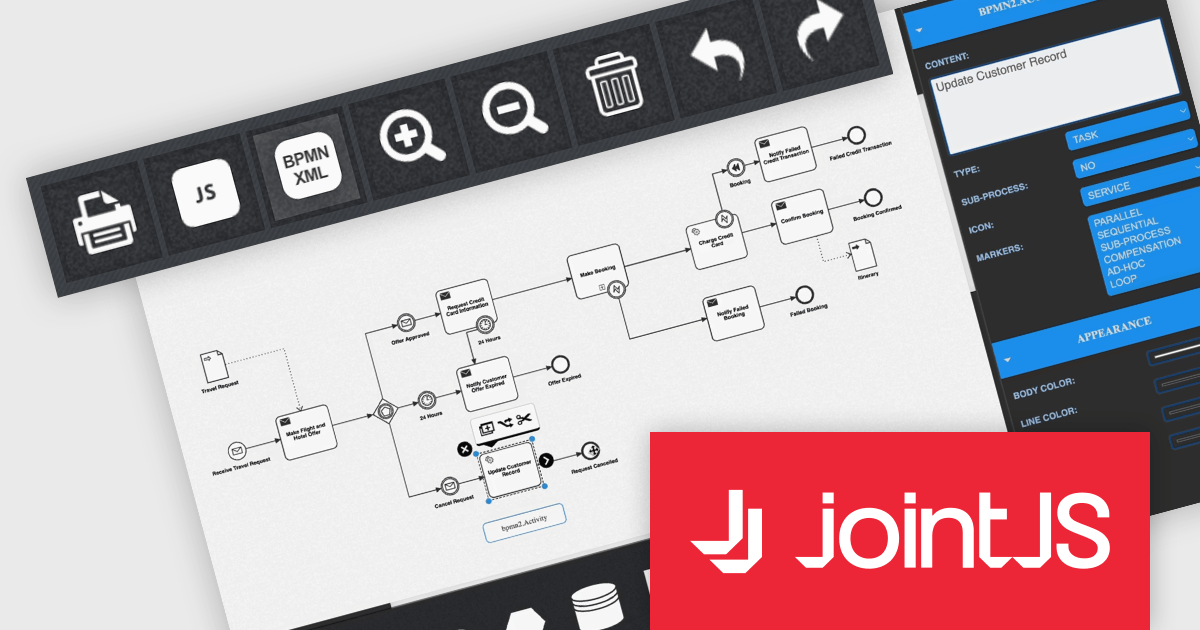
JointJS+ is a diagramming library that offers advanced features like custom shapes, data binding, and advanced layout algorithms, enabling you to create complex, interactive, and visually appealing diagrams. It includes a ready-to-use demo application that showcases its functionality and serves as a starting point for your own diagramming projects.
The JointJS+ 4.0 release introduces a significant advancement in business process management: seamless Business Process Modelling Notation XML import and export. This innovative feature empowers users to effortlessly translate BPMN diagrams into the BPMN XML format and vice versa, fostering interoperability across diverse tools and platforms, including editors and automation engines. JointJS+ 4.0 empowers process analysts, developers, and stakeholders alike to contribute and leverage BPMN diagrams with ease, paving the way for smoother and more efficient process management across the entire organization.
To see a full list of what's new in v4.0, see our release notes.
JointJS+ is licensed per developer and is available as a Perpetual license with 1 year support and maintenance. See our JointJS+ licensing page for full details.
Learn more on our JointJS+ product page.
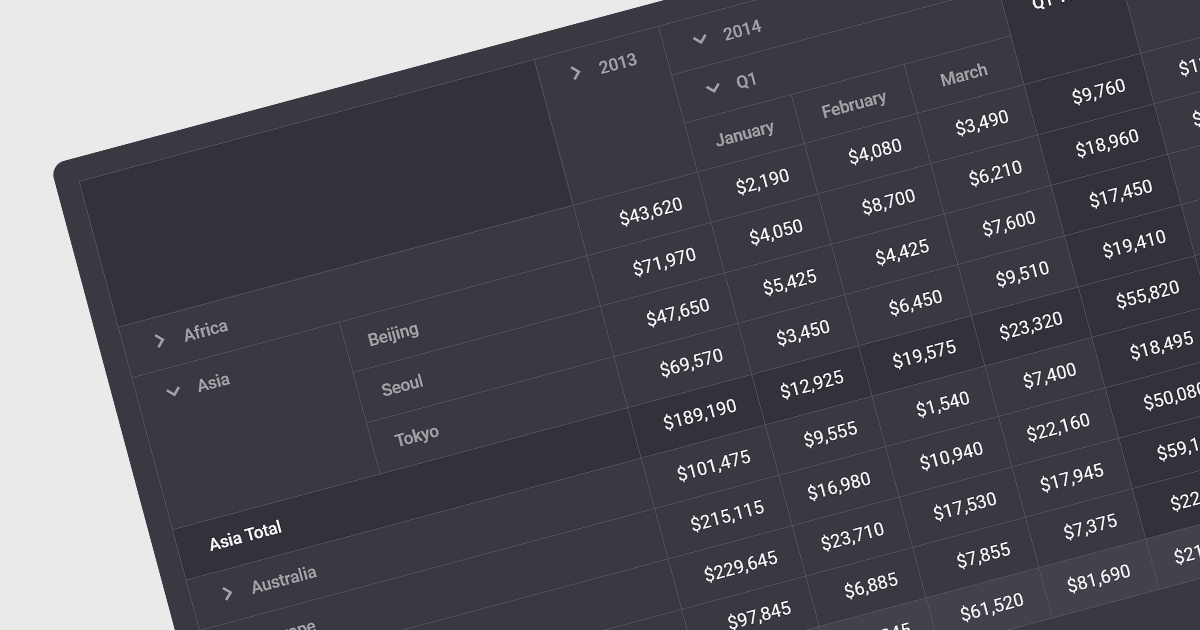
Drill-down capability within a grid control is a user-interactive feature that allows deeper exploration of summarized data. By clicking on specific cells or groups, users navigate down through hierarchical levels, uncovering increasingly granular details hidden within the aggregated view. This empowers informed decision-making by readily accessing both summarized overviews and underlying individual records, all within the familiar grid interface.
Several Angular grid controls offer drill-down capability including:
For an in-depth analysis of features and price, visit our Angular grid controls comparison.
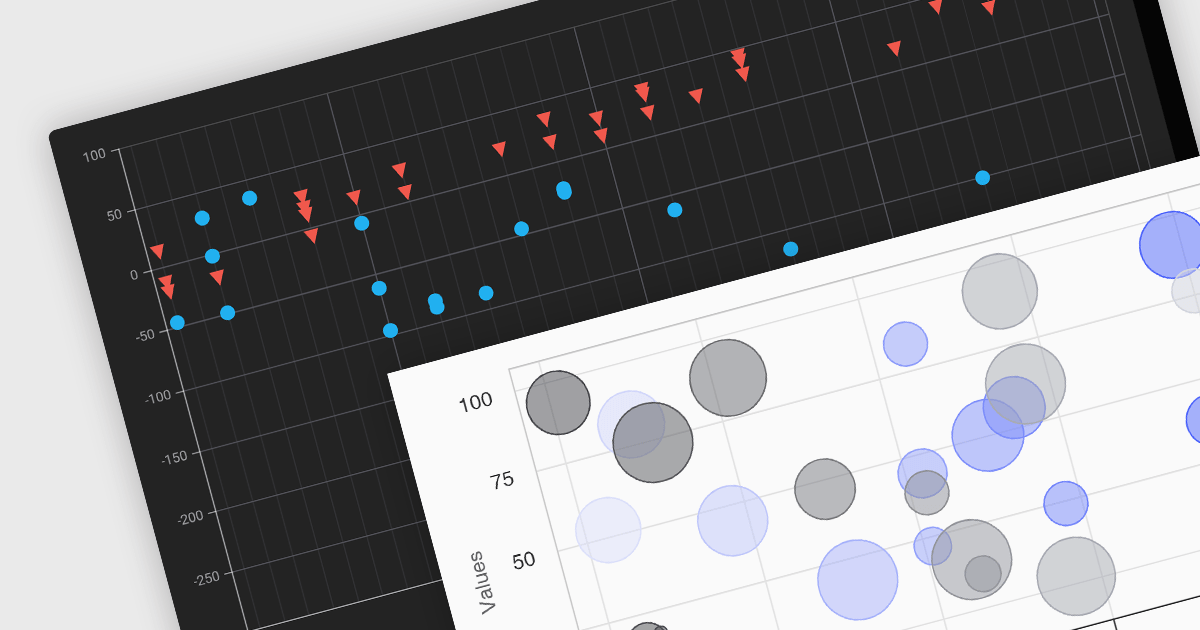
Scatter and bubble charts are used to display data points on a two-dimensional graph. While scatter charts use dots to represent data points, bubble charts add an additional dimension by varying the dot size, often representing volume or intensity. These charts are useful for showing relationships between variables and for identifying patterns or trends in data.
Several Angular chart controls offer scatter and bubble charts including:
For an in-depth analysis of features and price, visit our Angular chart controls comparison.
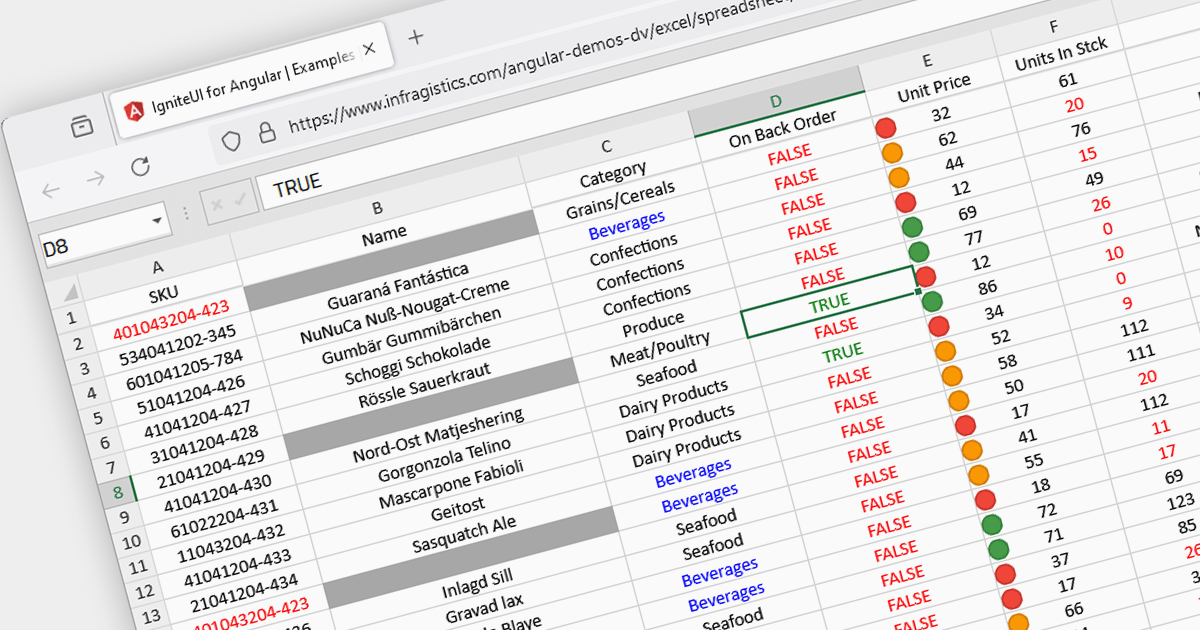
Conditional formatting in spreadsheets automates the visual highlighting of cells or ranges based on predefined criteria. This functionality aids data analysis by rapidly drawing attention to specific values, ranges, or text entries. By employing color scales, gradients, or text changes, conditional formatting helps users identify patterns, exceptions, and trends within large datasets, streamlining the interpretation and communication of key insights.
Several JavaScript spreadsheet controls offer conditional formatting including:
For an in-depth analysis of features and price, visit our comparison of JavaScript spreadsheets.
Tel: (888) 850 9911
Fax: +1 770 250 6199


