













Fornecedor oficial
Como distribuidores oficiais e autorizados, nós fornecemos licenças legítimas diretamente de mais de 200 editores de software.
Ver todas as nossas marcas.
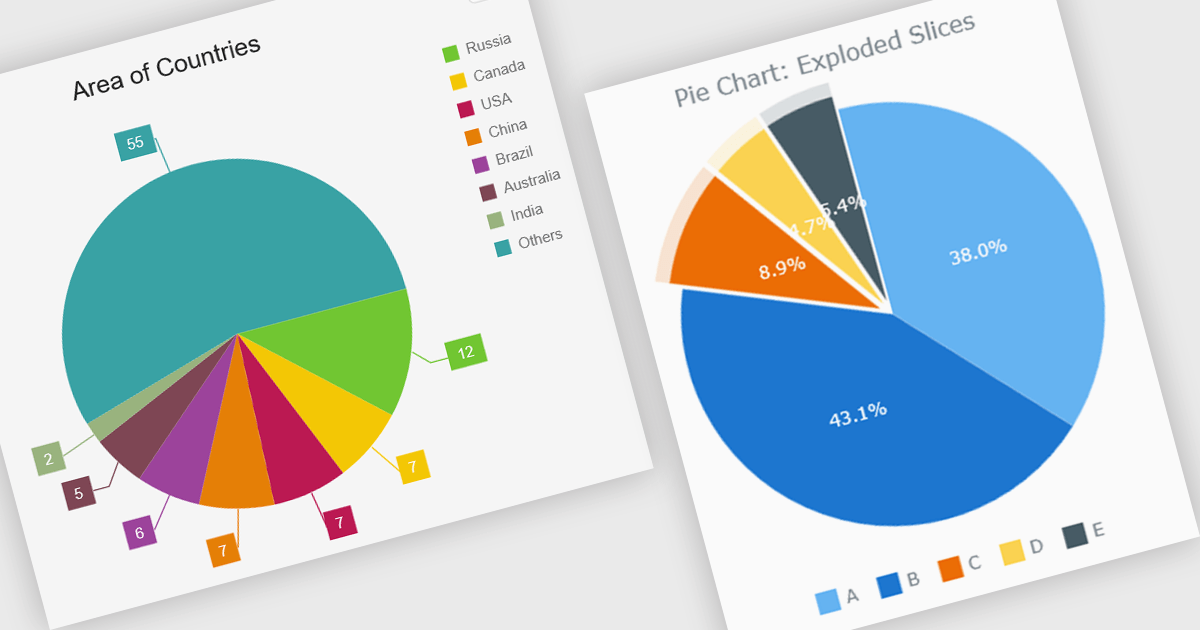
A pie chart enables developers to display data as proportional slices of a circle, with each slice representing a category's share of a single total. It is well suited to datasets that show part-to-whole relationships, making it easy for users to compare relative proportions at a glance. A well-designed implementation typically includes interactive features such as tooltips, legends, labels, animations, responsive layouts, and customization options, allowing the chart to integrate cleanly into modern web applications while providing a clear and accessible way to present composition data.
Several Vue.js chart components support pie charts, including:
For an in-depth analysis of features and price, visit our comparison of Vue.js charting components.
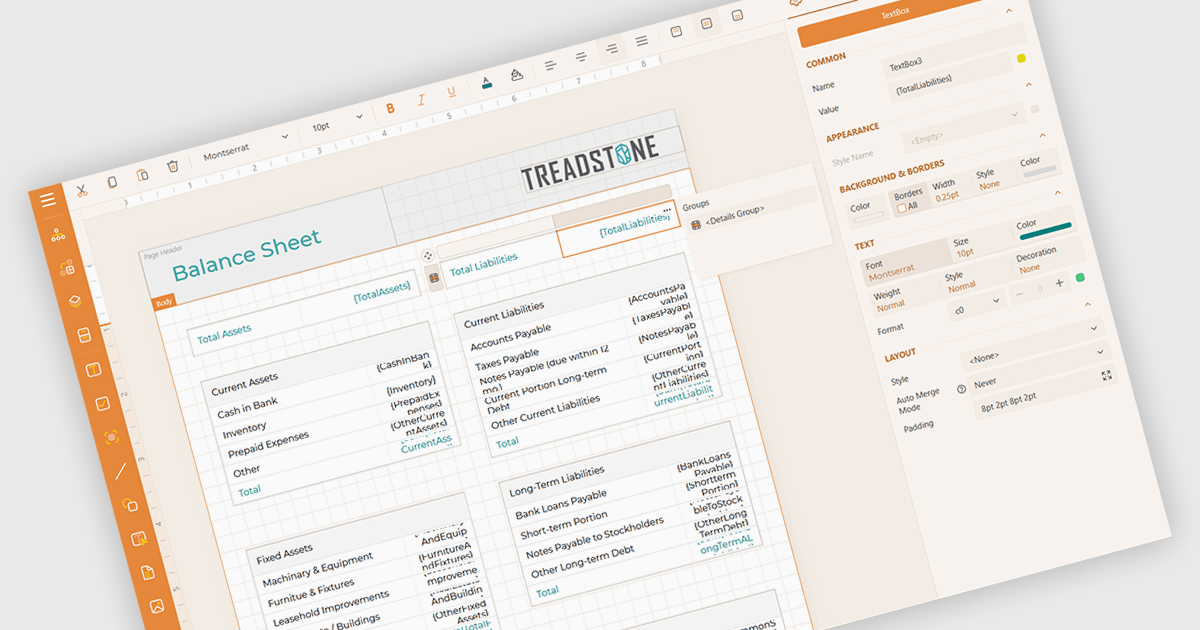
Calculated field support in a reporting component allows developers to define custom values by applying expressions, formulas, or functions to existing data without changing the underlying data source. This makes it possible to derive metrics such as totals, percentages, conditional values, or formatted output directly within a report, reducing the need for additional database queries or application logic. The result is greater flexibility when designing reports, faster adaptation to changing reporting requirements, improved report maintainability, and more consistent business calculations across reports.
Several Angular reporting controls offer support for calculated fields including:
For an in-depth analysis of features and price, visit our comparison of Angular reporting controls.
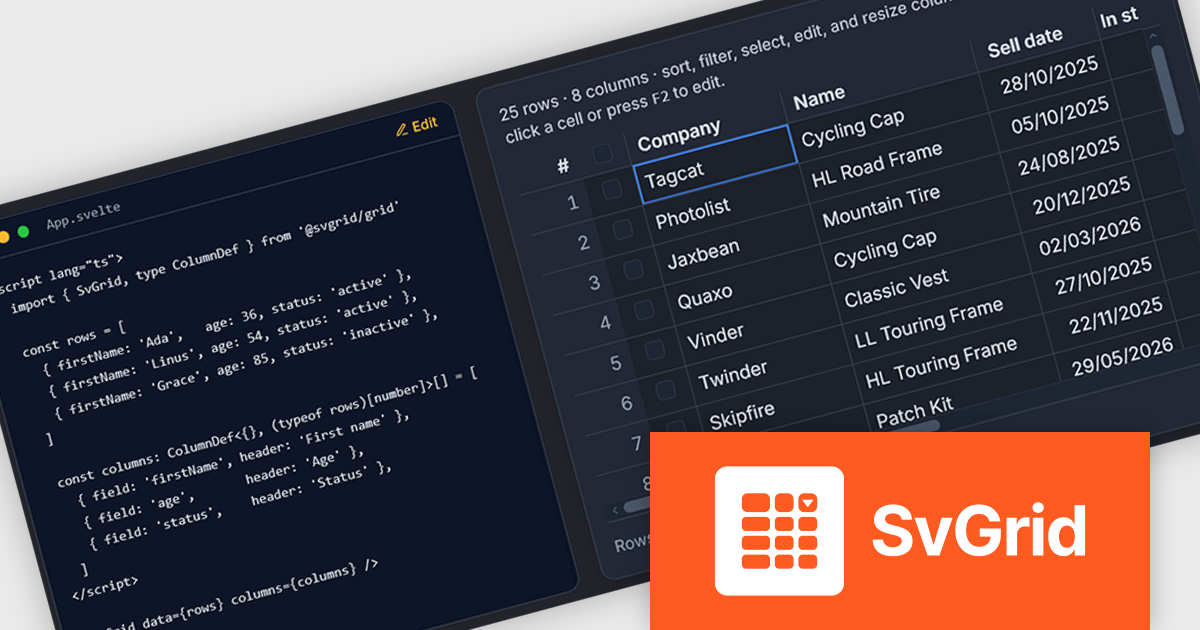
SvGrid is a modern data grid built specifically for Svelte, combining a headless data engine with a production-ready render component. Rather than adapting technology from another framework, it is designed around Svelte's native runes and reactivity model, giving developers an API that feels natural within Svelte applications. The grid supports a broad range of enterprise features, including sorting, Excel-style filtering, grouping, aggregation, inline editing, row and column virtualization, tree data, master-detail views, and server-side data integration, while remaining lightweight and easy to get started with.
SvGrid is intended for applications ranging from simple data tables to large-scale business systems handling hundreds of thousands of rows. Developers can choose the headless API for complete control over rendering or use the ready-made
SvGrid is licensed per developer and per app, and is available as a Perpetual License with one year of updates and support. See our SvGrid licensing page for full details.
For more information, visit our SvGrid product page.
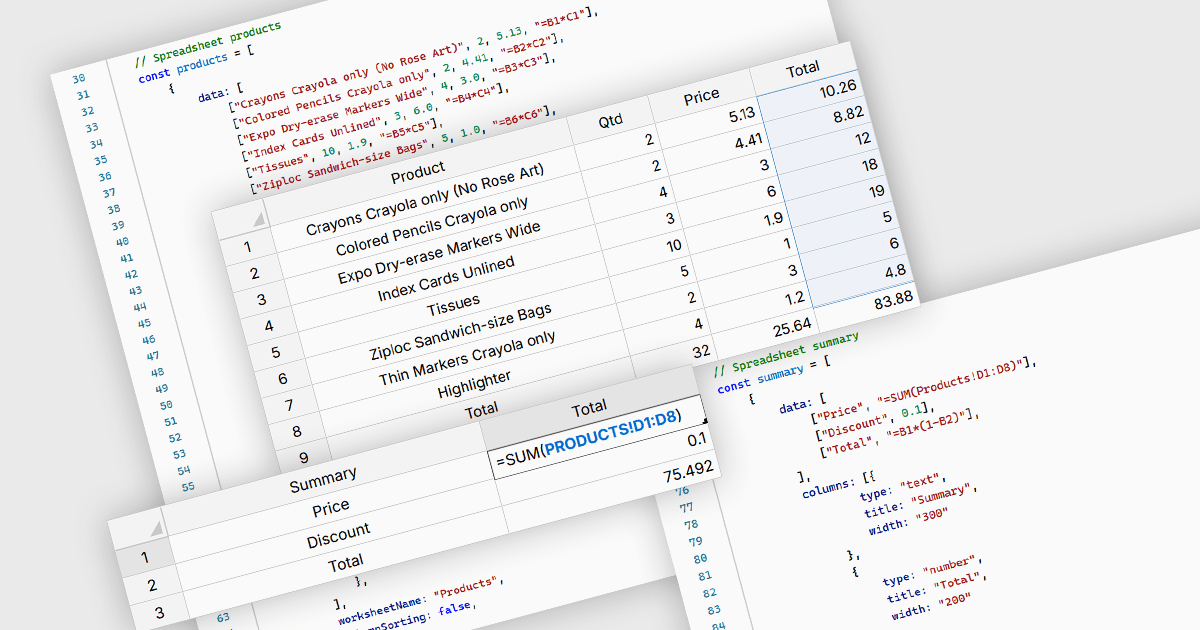
Cross-worksheet calculations allow formulas in one worksheet to reference cells, ranges, or named ranges located in another worksheet within the same spreadsheet. This capability enables related data to be organized across multiple worksheets while preserving links between them, reducing duplicated information, improving consistency, and making complex spreadsheet models easier to manage and maintain.
Several Vue.js spreadsheet components allow you to perform cross-worksheet calculations, including:
For an in-depth analysis of features and price, visit our comparison of Vue.js spreadsheet components.
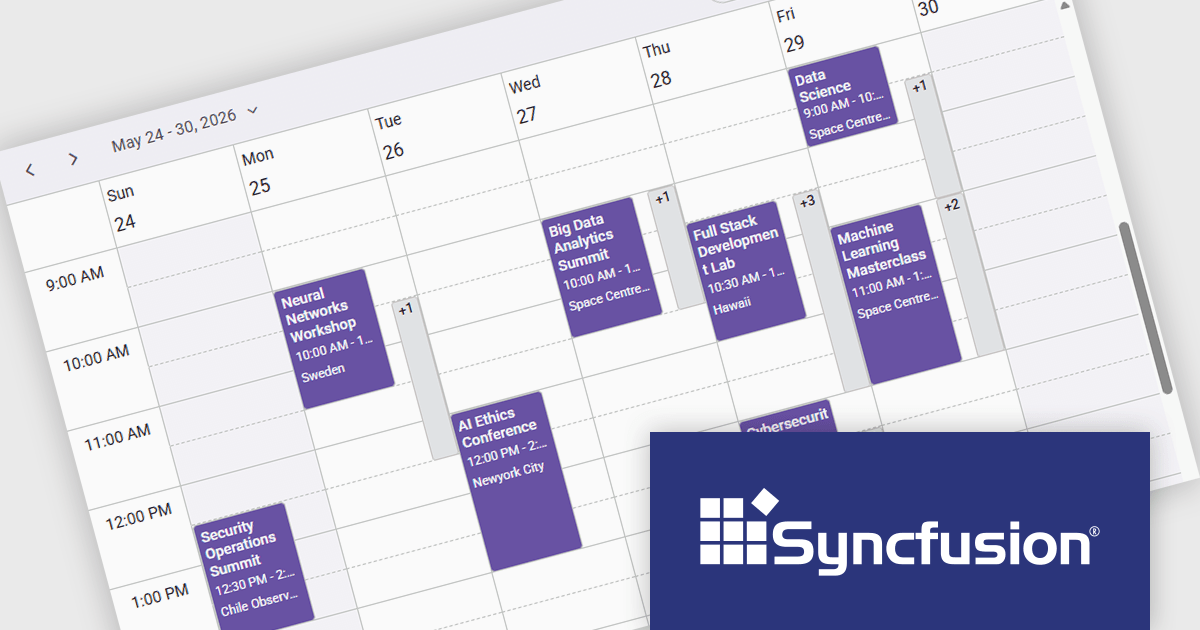
Syncfusion Essential Studio Enterprise provides a comprehensive collection of UI components and frameworks for building modern cross-platform applications. It offers over 1,800 components compatible with .NET WinForms, WPF, ASP.NET Core & MVC, WinUI, MAUI, JavaScript, Blazor, and more, enabling seamless application development across diverse devices and operating systems.
The latest Syncfusion Essential Studio Enterprise update introduces configurable limits for concurrent events in the Scheduler, allowing developers to control how many overlapping appointments are displayed within the same time range. This improves the readability of busy schedules by reducing visual clutter and making calendars easier to navigate while maintaining an organized user interface. The feature is particularly useful for applications such as booking systems, workforce management, healthcare scheduling, and resource planning where multiple events frequently occur at the same time.
Syncfusion Essential Studio Enterprise is licensed per developer and is available as a 12 Month Timed Subscription License which includes support and maintenance. See our Syncfusion Essential Studio Enterprise licensing page for full details.
Learn more on our Syncfusion Essential Studio Enterprise product page.
Tel: (888) 850 9911
Fax: +1 770 250 6199


