


Fornecedor oficial
Como distribuidores oficiais e autorizados, nós fornecemos licenças legítimas diretamente de mais de 200 editores de software.
Ver todas as nossas marcas.
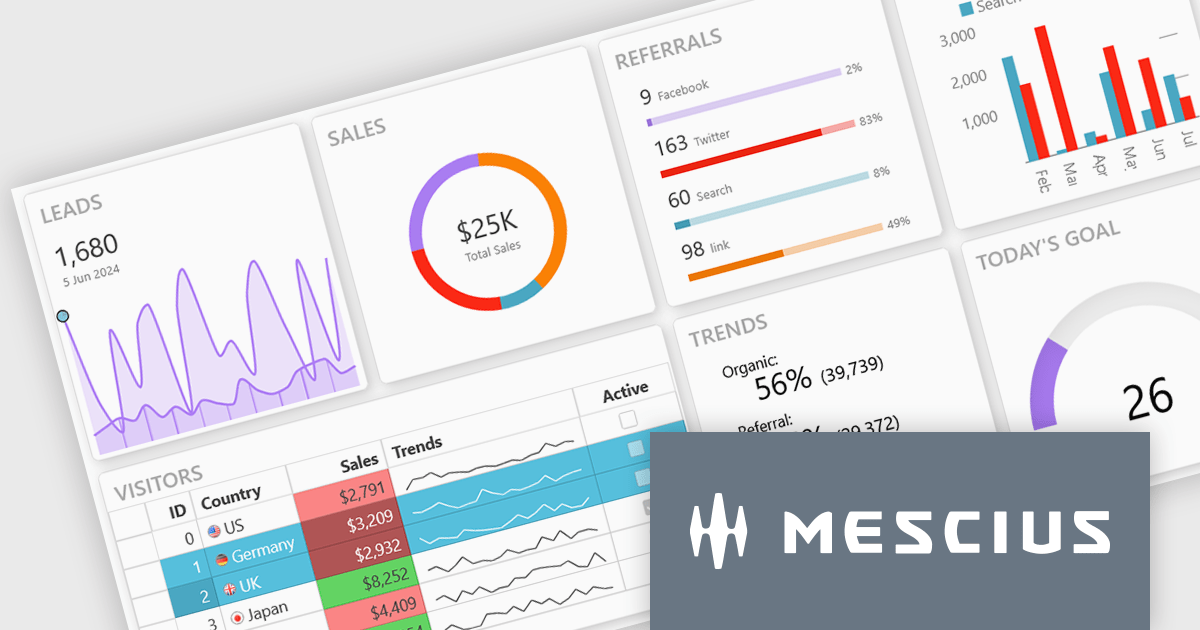
Wijmo is a complete collection of extensible, fast, flexible JavaScript UI components written in TypeScript. The framework-agnostic Wijmo components include first-class support for top frameworks including Angular, React, Vue and Web Components. Wijmo Enterprise has over 100 dynamic JavaScript UI components to help cut your development time in half and build lightweight, high-performance JavaScript applications using your favorite JavaScript framework.
On June 25, 2025 at 11:00 AM EDT, MESCIUS (formerly GrapeCIty) will be presenting a CodeClinic Live Webinar, exploring the 25 UX laws to give your apps an advantage over the competition. Learn why they are important, how to follow the industry's best practices, and how to apply them, assessing various popular web applications.
Register for the LIVE webinar today, and mark your calendar for June 25.
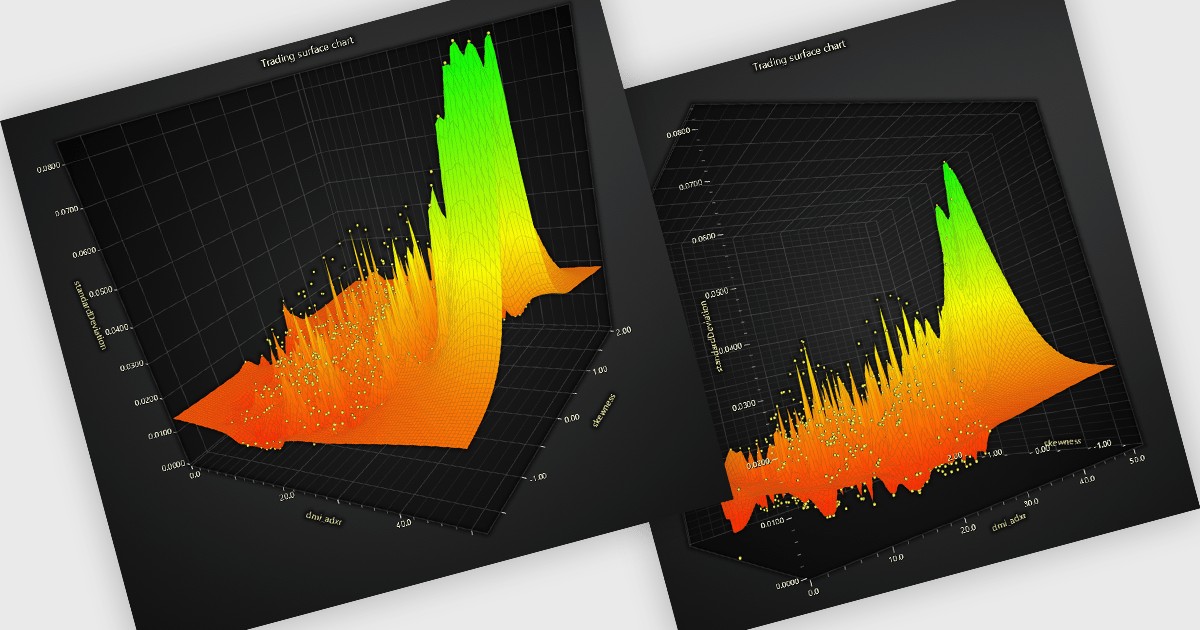
A surface chart is a powerful data visualization tool used to represent three-dimensional data, where the relationships between three numerical variables are plotted across a surface. By mapping values on the X, Y, and Z axes, and optionally applying dynamic color gradients to introduce a fourth variable, surface charts reveal patterns and correlations not easily detected in 2D charts. This makes them particularly valuable in fields such as engineering, scientific research, and finance. The ability to interpret multiple data dimensions simultaneously enables clearer insights and supports more informed, data-driven decisions.
Several JavaScript chart controls offer Surface Charts including:
For an in-depth analysis of features and price, visit our JavaScript chart controls comparison.
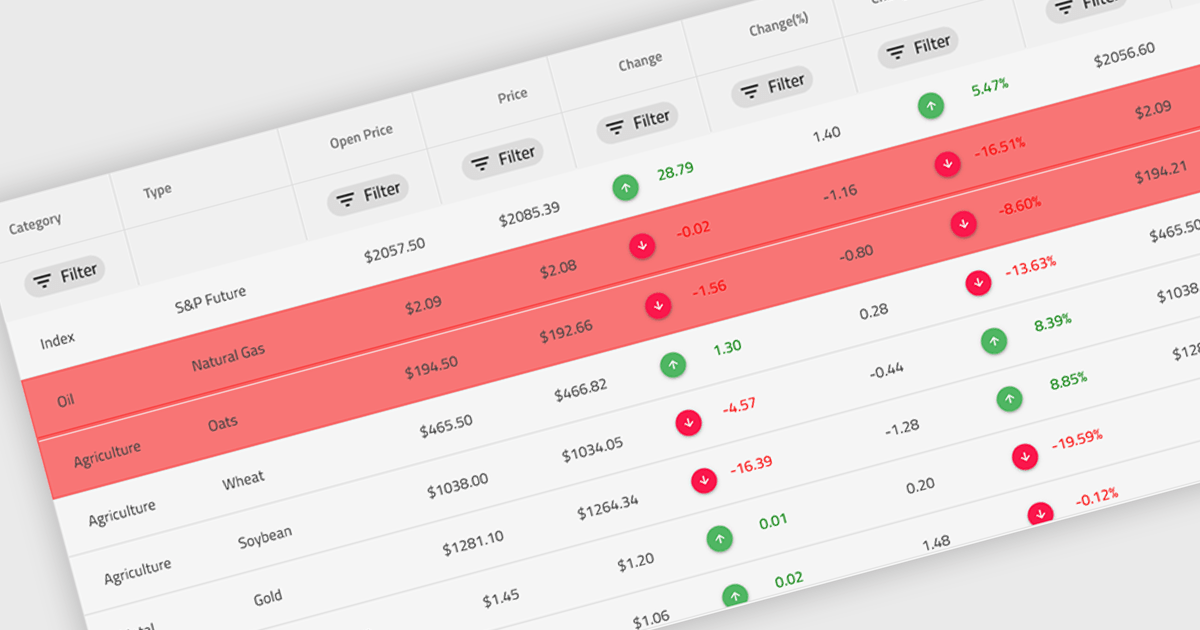
Conditional formatting in a grid refers to the dynamic application of visual styles—such as colors, icons, or font changes—to cells based on the values they contain or rules defined by the developer. This feature enables developers to visually differentiate data patterns, identify anomalies, or highlight critical values directly within a data grid without additional processing or user interaction. By presenting real-time visual cues tied to data content, conditional formatting enhances readability, supports quick analysis, and improves user decision-making, particularly in data-heavy applications where clarity and immediacy are essential.
Several Angular grid controls offer conditional formatting, including:
For an in-depth analysis of features and price, visit our comparison of Angular Grid controls.
KendoReact by Telerik is a comprehensive library of UI components specifically designed for building modern, feature-rich React applications, enabling developers to create intuitive, responsive, and visually appealing interfaces with ease. It includes robust components like data grids, charts, form elements, and navigation tools, optimized for high performance with features such as virtualization for large datasets and adherence to accessibility standards. Ideal for dashboards, enterprise apps, and data-driven applications, KendoReact enables teams to accelerate development, ensure design consistency, and deliver inclusive user experiences.
Telerik UI for Blazor is a comprehensive UI library that provides over 110 native and customizable Blazor components for building modern and feature-rich web applications. This professional-grade solution offers a complete set of components to satisfy all user interface requirements, saving time and effort in UI design.
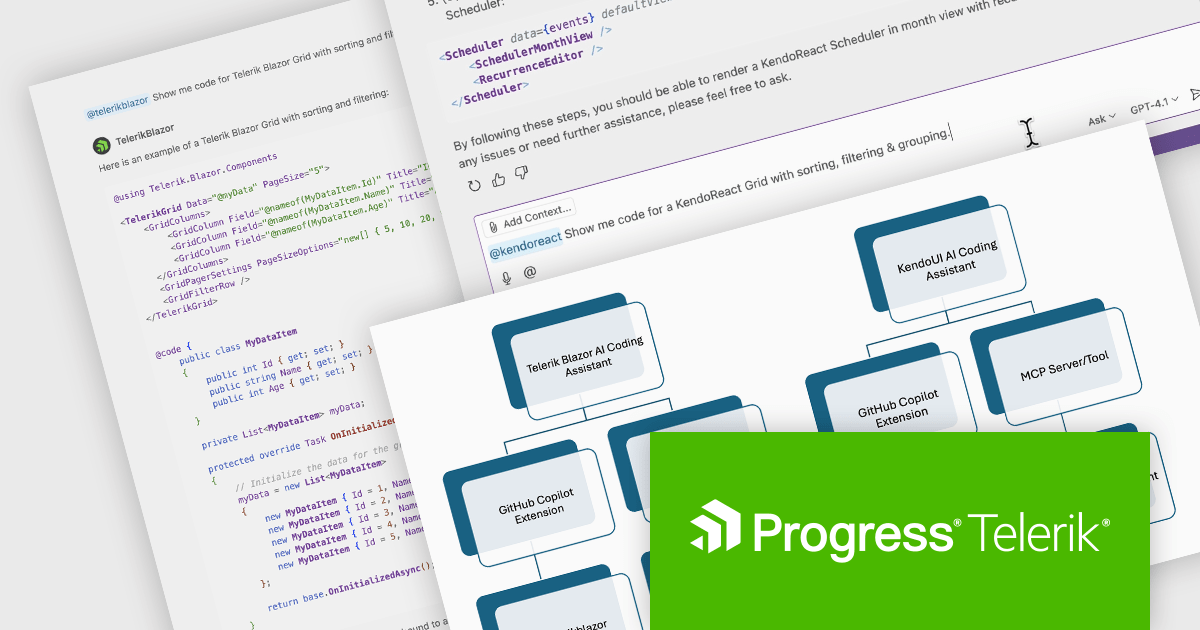
The Telerik 2025 Q2 update adds an IDE-integrated AI Coding Assistant to the KendoReact and Telerik UI for Blazor component libraries. Each coding assistant is an AI code generator that provides proprietary context to AI models in order to produce higher quality code samples based on the Telerik components and APIs for React and Blazor respectively. Developers are now able to generate and insert production-ready components via natural language prompts into their codebase.
To see a full list of what's new for each product in 2025 Q2, see our KendoReact and Telerik UI for Blazor release notes.
Both KendoReact and Telerik UI for Blazor are licensed per developer and have two licensing models: an annual Subscription License and a Perpetual License. The Subscription license provides access to the latest product updates, technical support, and exclusive benefits for a flat annual fee, and must be renewed to continue using the software. The Perpetual license is a one-time purchase granting access to the current released version and includes a one-year subscription for product updates and technical support. After this initial period, users can choose to renew the subscription element to continue receiving updates and support; otherwise, they may continue using the installed version available during their active subscription term but will forgo future updates and support. See our KendoReact licensing page and Telerik UI for Blazor licensing page for full details.
KendoReact is available individually or as part of the following products:
Telerik UI for Blazor is available individually or as part of the following products:
Kendo UI is a comprehensive suite of four JavaScript UI libraries for jQuery, Angular, React, and Vue that enables developers to build responsive web applications for desktop, tablet, and mobile platforms with minimal effort. It provides a wide range of customizable components such as data grids, charts, schedulers, and form controls that streamline development and can reduce time to market by up to 50 percent. With built-in support for theming, accessibility, localization, and state management, Kendo UI is ideal for creating data-driven dashboards, CRM systems, e-commerce portals, and administrative interfaces while maintaining high performance and a consistent user experience.
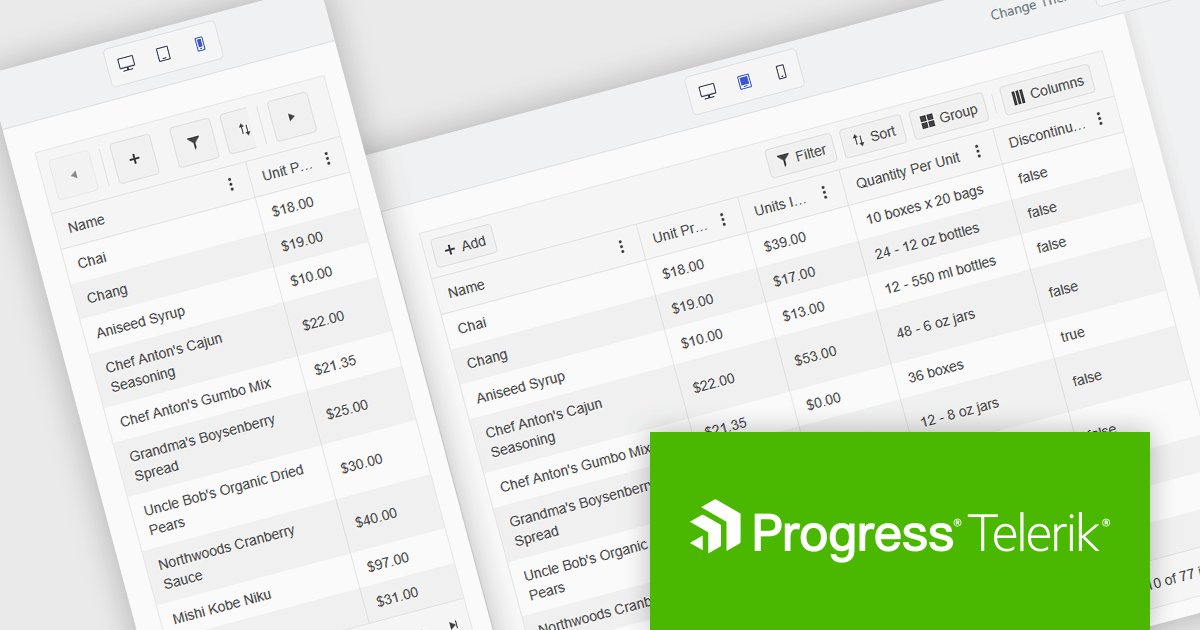
The Kendo UI 2025 Q2 update brings a major update to the Grid component, focusing on mobile usability. The Grid is now fully adaptive, meaning its layout and controls automatically adjust to different screen sizes. This includes new support for adaptive editing, where input forms rearrange themselves to fit smaller screens more effectively. The update also introduces improved form components and a responsive pager, helping users navigate data more easily on mobile devices. These changes aim to make working with the Grid more practical and efficient when using touch interfaces or limited screen space.
To see a full list of what's new in 2025 Q2 (v19.0.0), see our release notes.
Kendo UI is licensed per developer and has two licensing models: an annual Subscription License and a Perpetual License. The Subscription license provides access to the latest product updates, technical support, and exclusive benefits for a flat annual fee, and must be renewed to continue using the software. The Perpetual license is a one-time purchase granting access to the current released version and includes a one-year subscription for product updates and technical support. After this initial period, users can choose to renew the subscription element to continue receiving updates and support; otherwise, they may continue using the installed version available during their active subscription term but will forgo future updates and support. See our Kendo UI licensing page for full details.
Kendo UI is available individually or as part of the following products:
Tel: (888) 850 9911
Fax: +1 770 250 6199


