


Fornecedor oficial
Como distribuidores oficiais e autorizados, nós fornecemos licenças legítimas diretamente de mais de 200 editores de software.
Ver todas as nossas marcas.
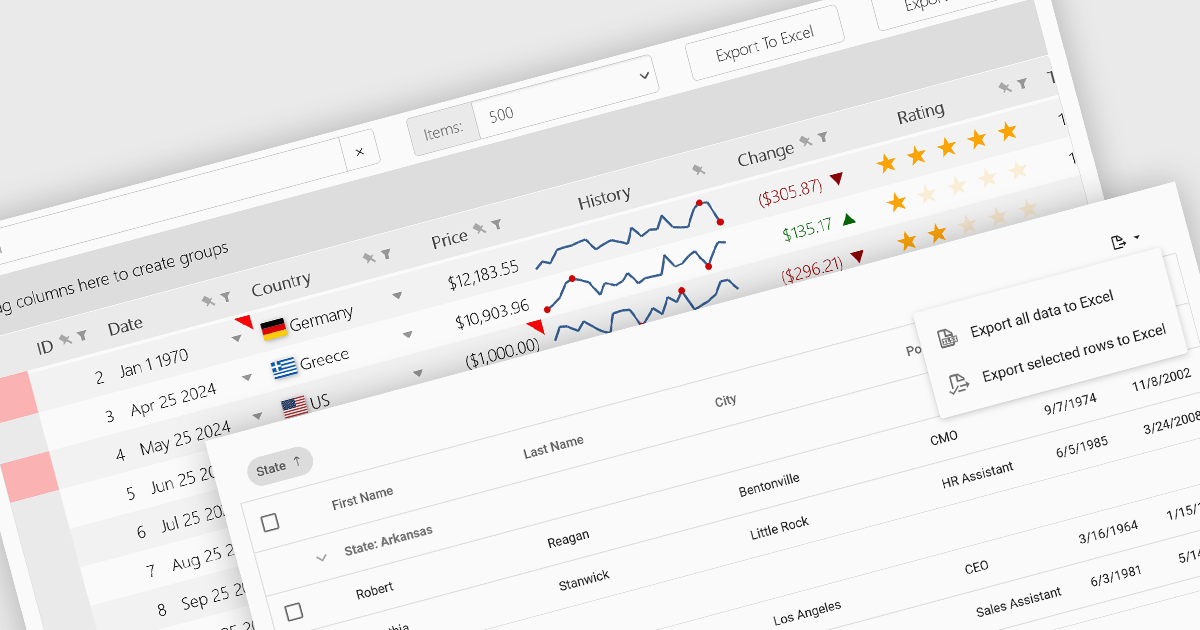
Grid controls with support for exporting to Excel offer users a portable and widely compatible format ideal for offline access, advanced analysis, and custom reporting. Excel’s powerful capabilities, including pivot tables, formulas, and charting tools, allow users to perform sophisticated tasks that go beyond the grid’s native functionality. Additionally, this feature facilitates seamless integration with other workflows and systems, supporting record-keeping, collaboration, and compliance requirements. By enabling greater flexibility and productivity, Excel export functionality significantly enhances the value and usability of grid applications.
Several React grid controls offer the ability to export grids to Excel including:
For an in-depth analysis of features and price, visit our React grid controls comparison.
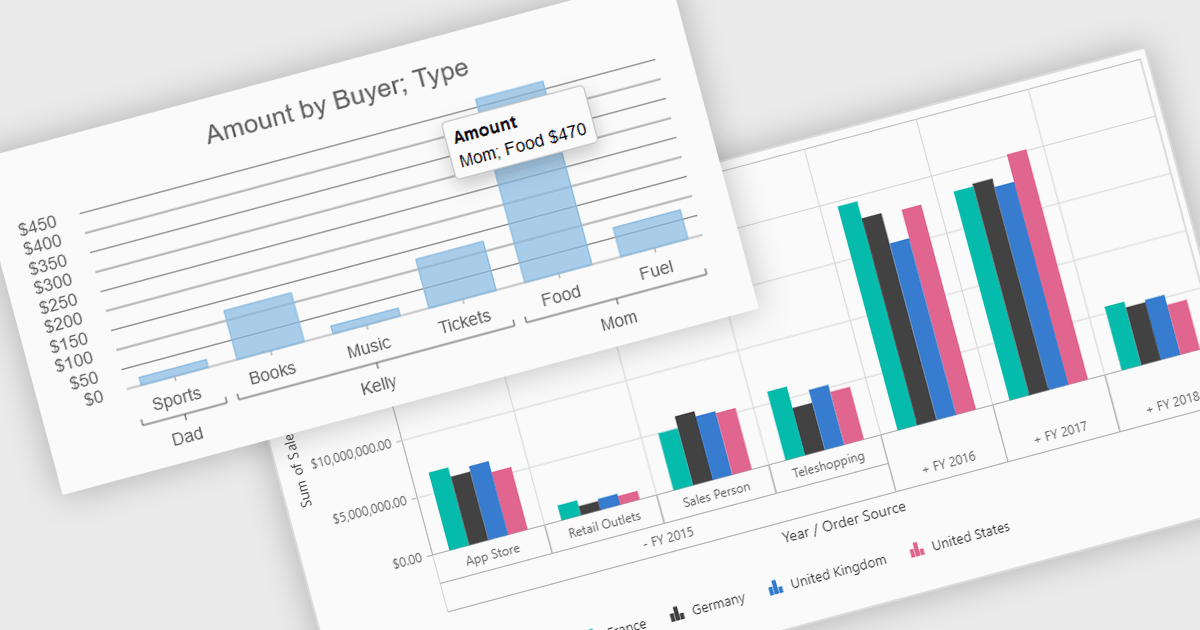
Pivot charts are dynamic visualization tools that enable users to interact with and analyze data in a highly flexible manner. They extend the capabilities of pivot tables by providing visual representations of aggregated data, making it easier to identify trends, patterns, and outliers. Key benefits include real-time updates, intuitive interactivity, and support for multi-dimensional data analysis, which simplifies complex datasets into actionable insights. Integrating pivot charts into your applications empowers end-users to explore and present data in a way that is both visually compelling and deeply informative.
Several React UI suites offer pivot chart components including:
For an in-depth analysis of features and price, visit our comparison of React UI Suites.
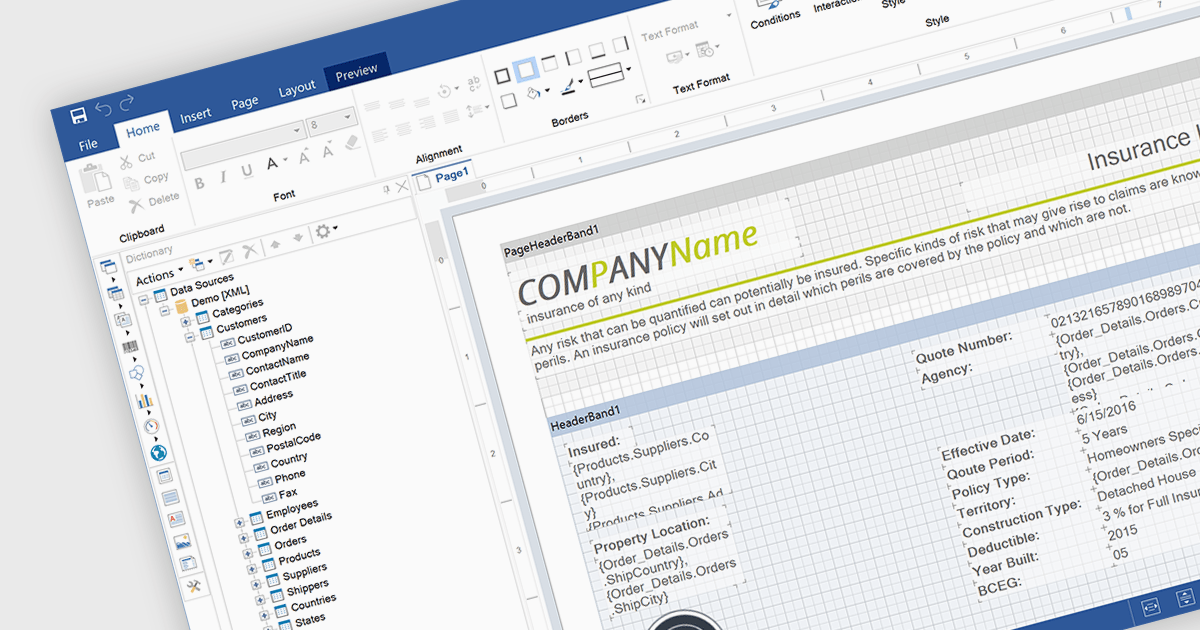
An end user report designer is a browser-based tool that allows non-technical users to create, edit, and customize reports directly within a web application, without needing to write code. It provides an intuitive interface for manipulating data fields, applying filters, formatting content, and configuring layouts, enabling efficient report creation that meets specific business needs. For developers, integrating such a designer reduces the overhead of building and maintaining custom reporting solutions, enhances user autonomy, and improves overall user satisfaction by empowering clients to adapt reports dynamically as their requirements evolve.
Several JavaScript Reporting controls offer an end user report designer including:
For an in-depth analysis of features and price, visit our comparison of JavaScript Reporting Controls.
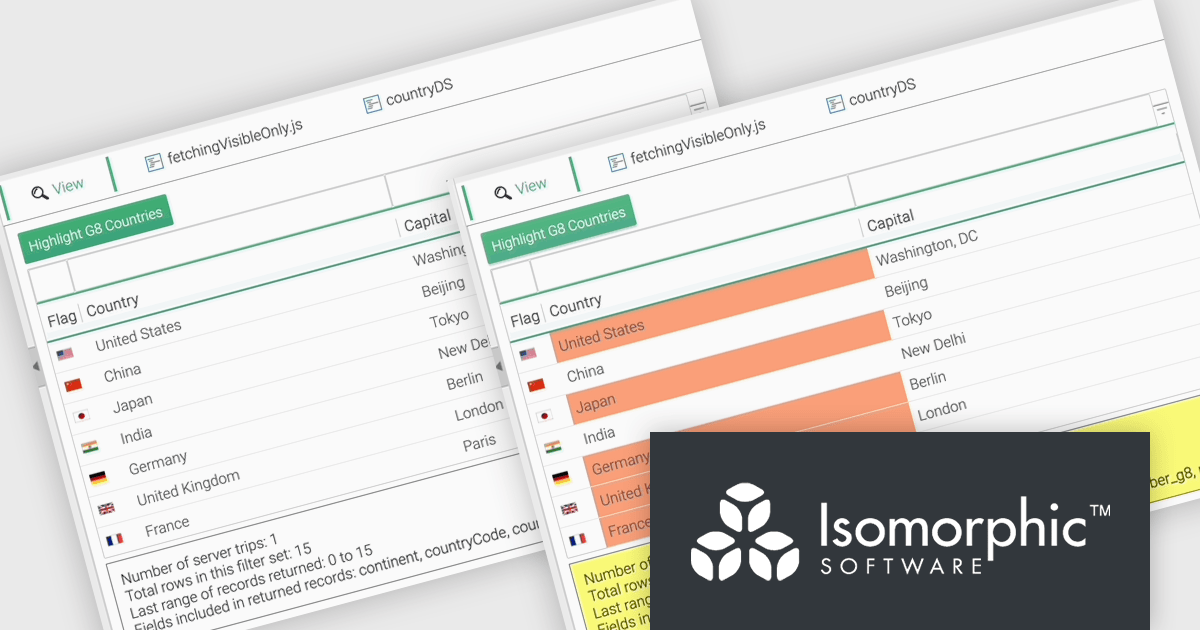
SmartClient is a comprehensive JavaScript component suite compatible with React, Vue, Angular, and more, that empowers you to craft large-scale, high-productivity Enterprise web applications. It provides a comprehensive set of tools for developers, including advanced UI components, robust data management capabilities, and seamless integration with modern backend technologies. Key features include dynamic data fetching, customizable grids, and a responsive interface for a wide range of devices. SmartClient enables developers to create applications with optimized performance, scalability, and a superior user experience. Ideal for enterprise-grade use cases, such as financial analytics, inventory management, and real-time reporting, SmartClient empowers organizations to deliver feature-rich applications that handle complex data requirements with ease.
The SmartClient 13.1 update introduces the Fetch Only Needed Data feature, enabling developers to optimize performance in data-intensive applications by dynamically retrieving only the fields required at a given moment. This targeted data retrieval reduces unnecessary data transfers, minimizes backend load, and enhances responsiveness. Developers can configure grids to fetch additional fields on demand, ensuring efficient resource usage while maintaining flexibility to adapt to dynamic application requirements. By integrating this feature, applications can scale effectively, provide a smoother user experience, and meet the demands of high-performance environments.
To see a full list of what’s new in version 13.1, see our release notes.
SmartClient is licensed per developer and is available as both perpetual and subscription licenses. Product updates and technical support is also available. See our SmartClient licensing page for full details.
For more information, visit our SmartClient product page.

PrizmDoc is a comprehensive REST API platform designed to streamline the integration of secure document viewing, editing, and processing into web applications. Beyond standard features like redaction and annotation, PrizmDoc leverages advanced AI-powered tools to automate and optimize document handling processes, significantly reducing manual effort and boosting productivity. This enables businesses to enhance their document workflows, improve security, and deliver a superior user experience.
On Tuesday, December 3 at 1:00 PM EST Accusoft is presenting a Live Webinar: Exploring Future Trends in AI-Driven Document Management. Discover how PrizmDoc® and IBM watsonx AI are setting new standards for advanced document processing and management, especially within Enterprise Content Management (ECM) applications. Topics will include:
Register today and and discover how AI can streamline workflows and provide secure, effective document management.
PrizmDoc Viewer is available as Self-Hosted, Cloud-Hosted or Private Cloud-Hosted deployments. Billed on an annual subscription basis, you will need to renew your license each year to continue to use the software. The price is based on the number of servers or the number of transactions you require, depending on your deployment method. See our PrizmDoc Viewer licensing page for full details.
For more information, see our PrizmDoc Viewer product page.
Tel: (888) 850 9911
Fax: +1 770 250 6199


