


Fornecedor oficial
Como distribuidores oficiais e autorizados, nós fornecemos licenças legítimas diretamente de mais de 200 editores de software.
Ver todas as nossas marcas.
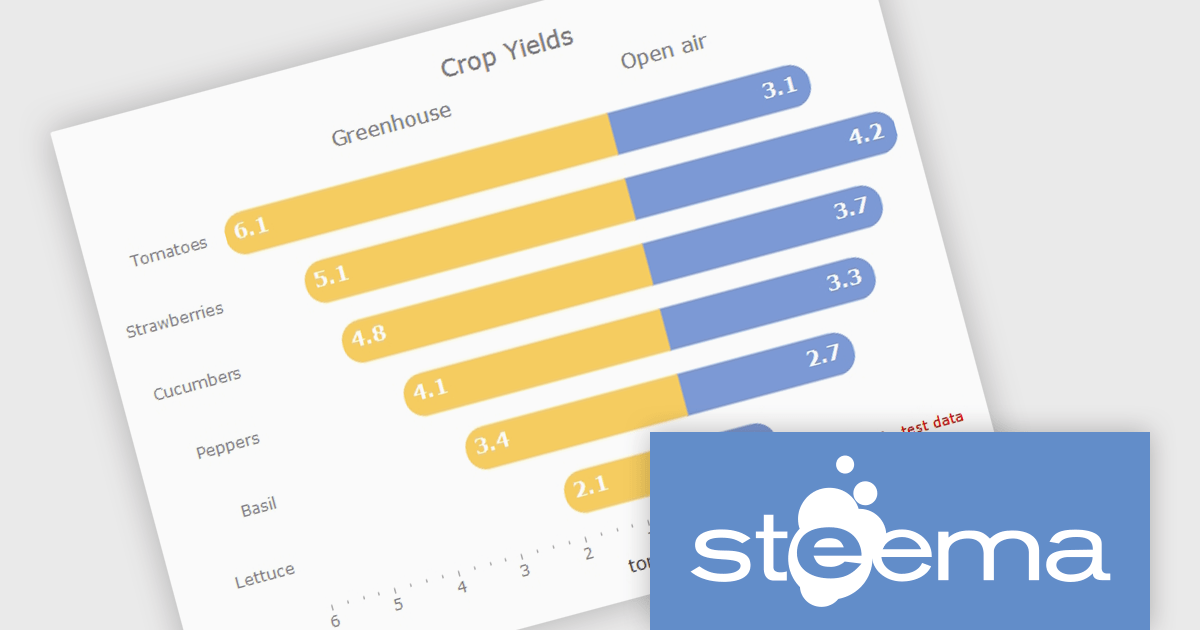
TeeChart for .NET is a comprehensive charting solution that enables developers to create informative, visually compelling charts for financial, scientific, statistical, and business applications. It manages complex data and delivers interactive visualizations. With optional source code and enterprise editions that include mobile and JavaScript components, TeeChart for .NET provides flexibility, customization, and consistent charting across desktop, web, and mobile platforms.
The TeeChart for .NET 2006 update introduces a Tornado Chart series type that enables developers to present structured side-by-side comparisons and perform sensitivity analysis. This chart type is particularly effective for highlighting the relative impact of multiple variables, making it well suited for financial modeling, risk assessment, and analytical dashboards. By offering built-in support within the existing TeeChart framework, it reduces the need for custom visualization logic, accelerates development time, and ensures consistent integration across reporting, analytics, and business applications.
To see a full list of what's new in version 2026, see our release notes.
TeeChart for .NET is licensed per developer and is available as a perpetual license. Each license includes one year of updates and upgrades. See our TeeChart for .NET Pro Edition licensing page for full details.
This update for TeeChart for .NET is available is available in the following products:

Right to left (RTL) support in reporting components enables reports to correctly display languages such as Arabic and Hebrew, where text flow, alignment, and layout follow a right-to-left reading order. This capability typically affects text rendering, page layout, table alignment, and user interface elements, helping reports remain readable and culturally appropriate without requiring separate report designs.
Several Blazor reporting controls offer right-to-left (RTL) support including:
For an in-depth analysis of features and price, visit our Blazor reporting controls comparison.
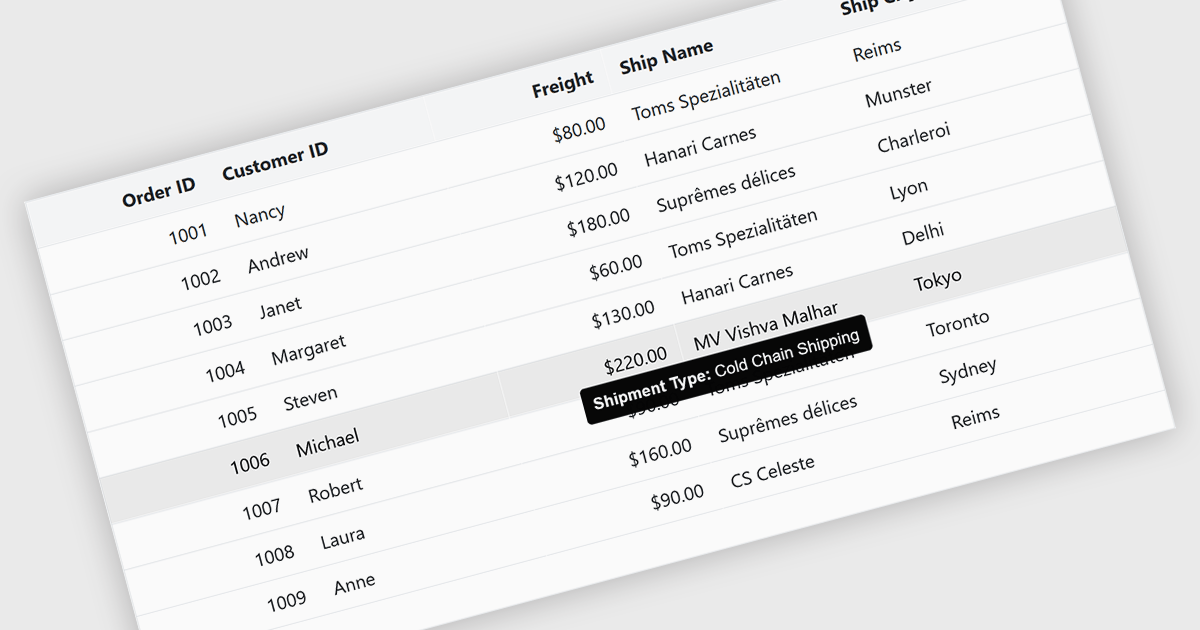
Tooltips in grid components provide contextual information that appears when users hover over or focus on a cell, column header, or row. It offers a practical way to surface additional details such as full text for truncated values, validation messages, or explanatory metadata without overcrowding the grid layout. For data-heavy interfaces, this feature improves readability and usability by keeping the primary view concise while still making secondary information readily accessible when needed.
Several Blazor grid controls offer FEATURE including:
For an in-depth analysis of features and price, visit our Blazor grid controls comparison.
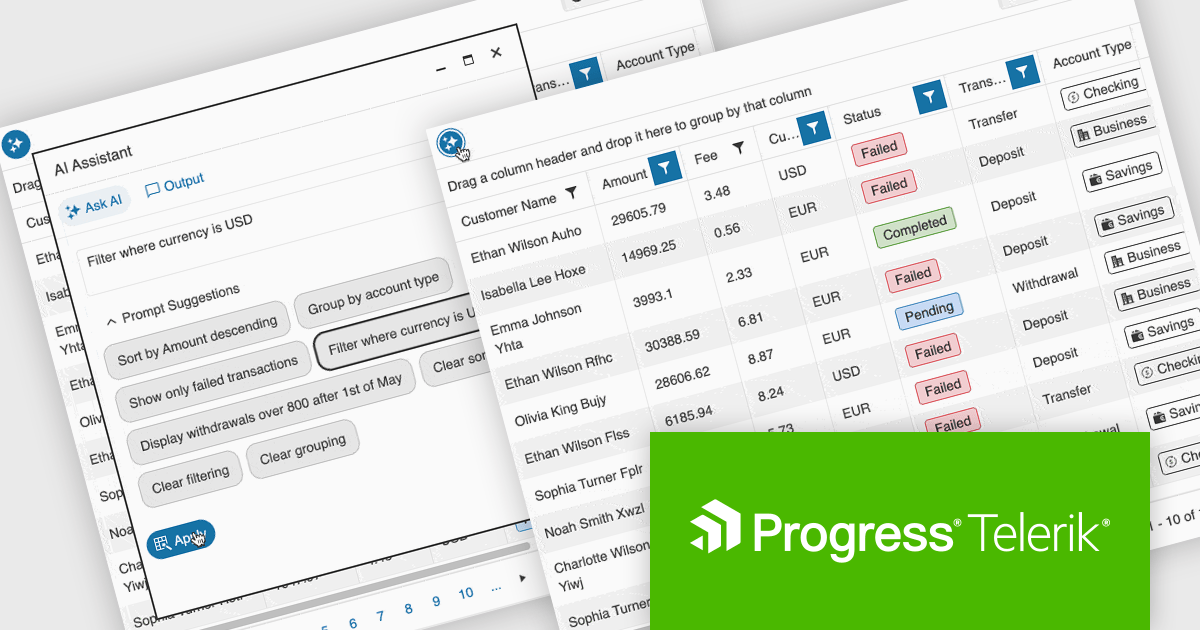
Telerik UI for ASP.NET Core, MVC, and Blazor are component libraries for building modern web apps with .NET. Each provides a rich set of customizable UI elements, like grids, charts, and forms, tailored to its respective framework, helping developers create responsive, interactive, and accessible user interfaces.
The latest update to the Telerik UI DataGrid introduces AI-driven controls that respond to natural-language prompts, making it easier for users to work with complex datasets. Users can now reorder, resize, and toggle column visibility just by describing what they want. Pagination, row selection, and data export to Excel, PDF, or CSV formats can also be handled through conversational input, reducing clicks and improving accessibility for both technical and non-technical users.
Telerik UI for ASP.NET Core, UI for MVC, and UI for Blazor are all licensed per developer and have two licensing models: an annual Subscription License and a Perpetual License. The Subscription License must be renewed to continue using the software. The Perpetual license is a one-time purchase granting access to the current released version and includes a one-year subscription for product updates and technical support. See our Telerik UI for ASP.NET Core, Telerik UI for ASP.NET MVC or Telerik UI for Blazor licensing pages for full details.
Telerik UI for ASP.NET Core, Telerik UI for ASP.NET MVC and Telerik UI for Blazor are available to buy individually or as part of the following products:
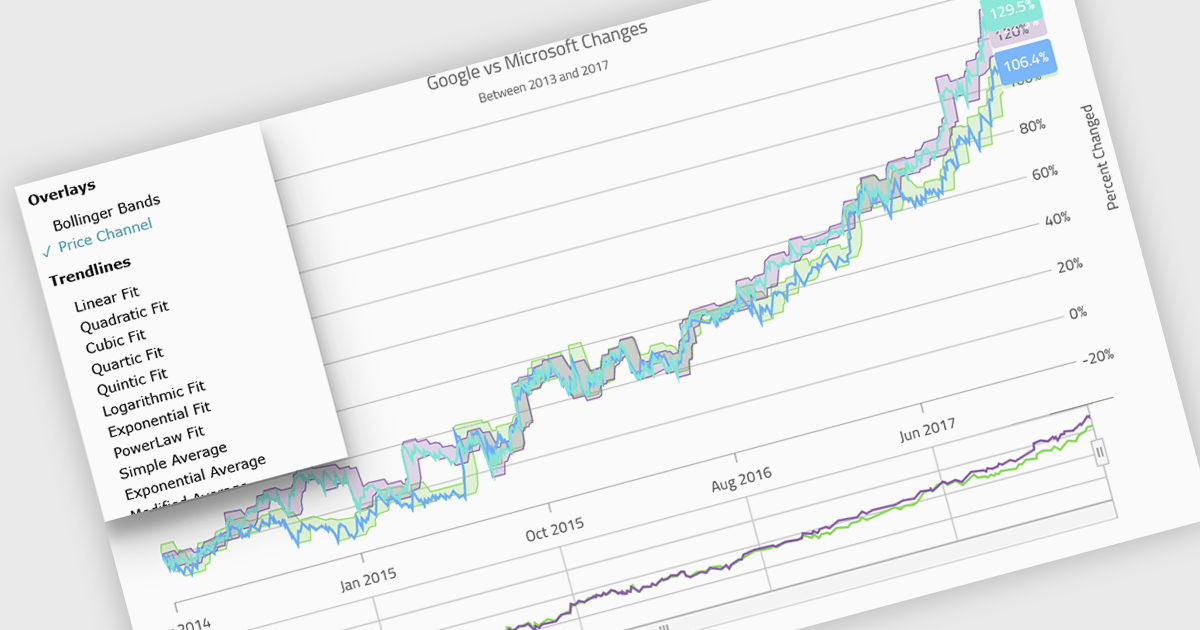
Indicators in a chart component are visual tools used to represent specific statistical or mathematical calculations directly on the chart, often to highlight trends, patterns, or key thresholds within the underlying data. Common in financial and analytical applications, indicators can include elements like moving averages, Bollinger Bands, or threshold lines. For software developers, implementing indicators provides a powerful way to enhance data interpretation by allowing users to see meaningful context and actionable insights without needing to leave the chart interface. This improves decision-making and supports more interactive and informative visualizations across a wide range of use cases.
Several .NET Blazor charting controls support indicators including:
For an in-depth analysis of features and price, visit our comparison of .NET Blazor Chart Controls.
Tel: (888) 850 9911
Fax: +1 770 250 6199


