


Fornecedor oficial
Como distribuidores oficiais e autorizados, nós fornecemos licenças legítimas diretamente de mais de 200 editores de software.
Ver todas as nossas marcas.

Infragistics Ultimate offers a comprehensive library of enterprise-grade, high-performance grids, charts, and other UI controls, plus visual configuration tooling, rapid prototyping, and usability testing. It comes with controls for Angular, React, jQuery, Web Components, Blazor, ASP.NET MVC, ASP.NET Core, ASP.NET Web Forms, Windows Forms, WPF and Xamarin.
Infragistics Ultimate 23.2 includes the updated Ignite UI for Blazor Data Grid and Blazor Table which are specifically crafted to effectively manage substantial datasets while maintaining essential interactive capabilities. They offer features such as virtualization for enhanced performance, row grouping and pinning, built-in columns with functionalities like filtering, moving, resizing, and sorting, as well as responsive layout support and collapsible group headers. These components are designed to cater to the practical needs of developers working with Blazor, providing them with reliable tools for efficiently handling large volumes of data within their applications.
Infragistics Ultimate is licensed per developer and is available as a Perpetual License with a 1, 2 or 3 year support and maintenance subscription. See our Infragistics Ultimate licensing page for full details.
The Ignite UI for Blazor Data Grid is available in the following products:
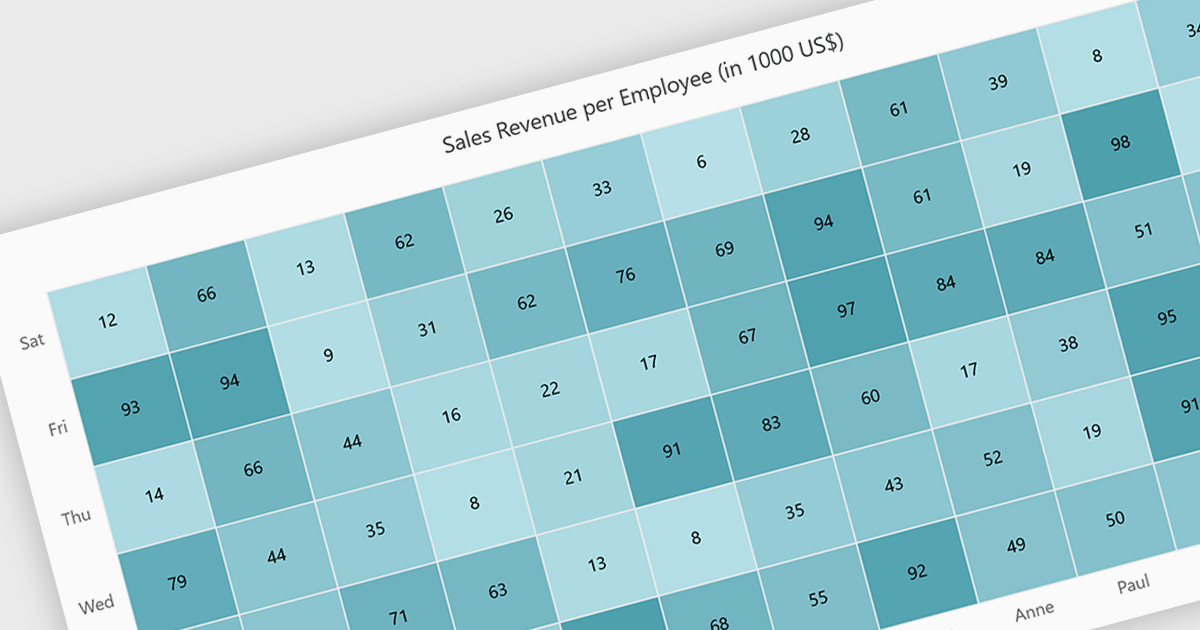
A heatmap is a data visualization tool that uses color intensity to represent magnitude within a dataset. This allows for quick identification of patterns and trends across two variables, depicted on the map's axes. Heatmaps are valuable for analyzing geographic data, user website interaction, and any other scenario where you need to visually grasp the distribution of data points.
Several Blazor chart controls offer Heatmaps including:
For an in-depth analysis of features and price, visit our Blazor chart controls comparison.
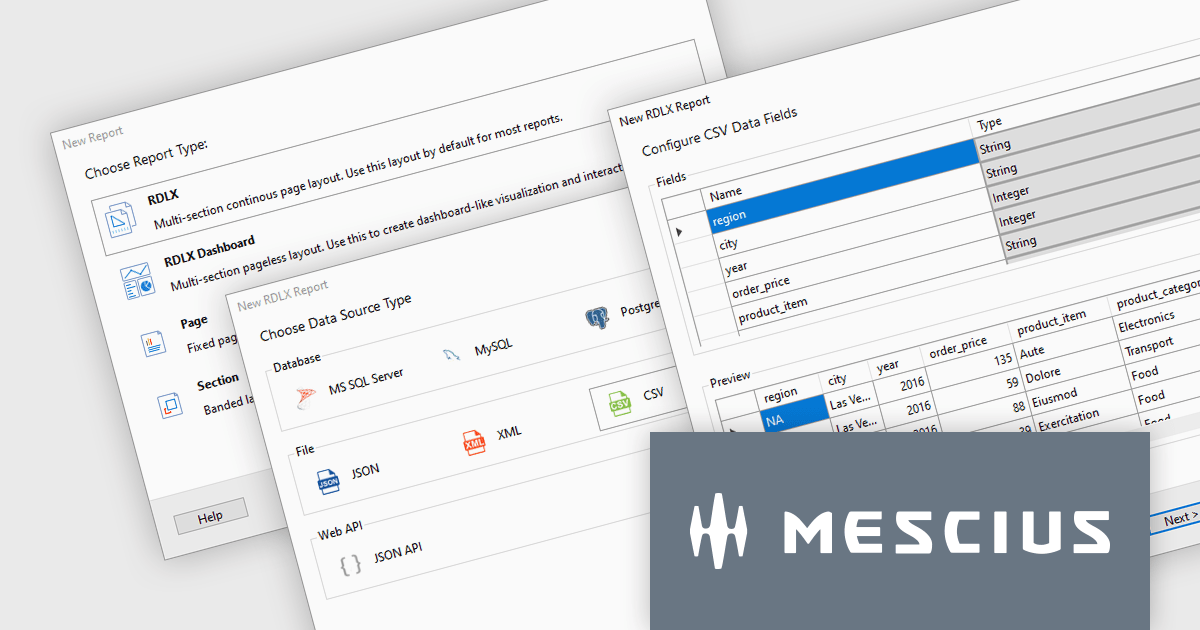
ActiveReports.NET is a reporting tool that allows developers to design and deliver reports with intuitive, reliable, and user-friendly report designers and controls. Features include the ability to create reports in a variety of formats, such as PDF, Excel, and HTML. ActiveReports.NET is also highly customizable, with an extensive API and advanced feature library.
ActiveReports.NET v18 introduces a powerful Report Wizard to streamline the creation of RDLX, Page, and Dashboard reports. This intuitive wizard expertly guides you through the entire report design process, from initial configuration to seamless data binding. Whether you're crafting detailed financial reports, visually rich data dashboards, or any other type of document-based presentation, the wizard ensures a smooth experience. This new feature helps you transform raw data into clear, actionable insights with ease.
To see a full list of what's new in version 18, see our release notes.
ActiveReports.NET is licensed per developer and is available with or without a 12 month support and maintenance subscription. See our ActiveReports.NET licensing page for full details.
For more information, visit our ActiveReports.NET product page.
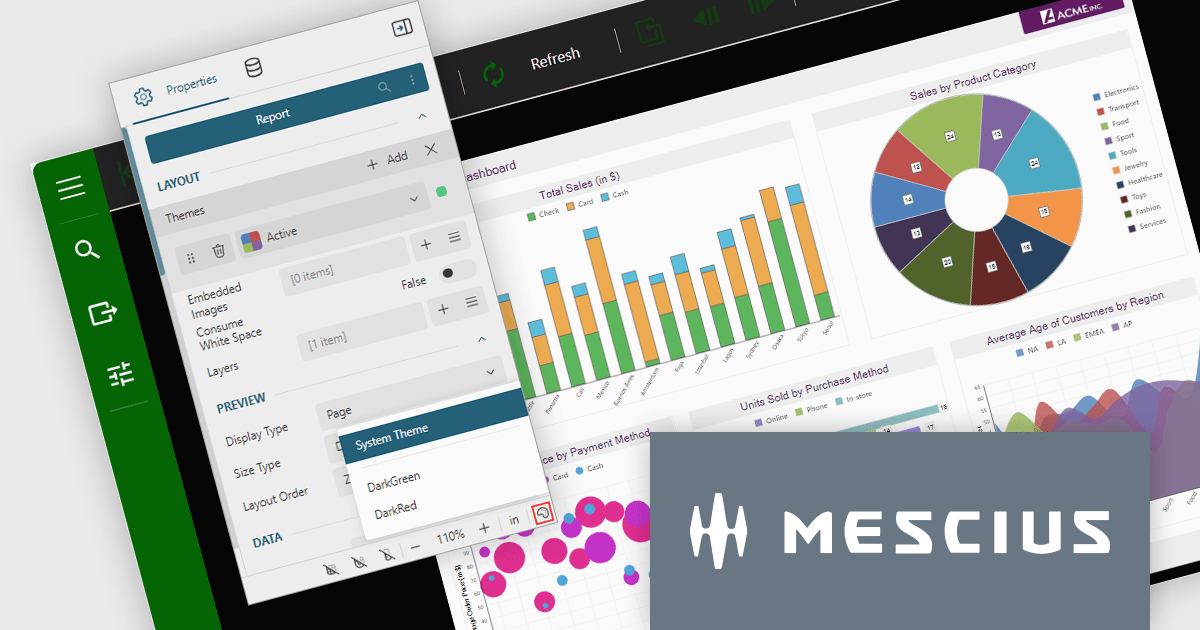
ActiveReports.NET is a reporting tool that allows developers to design and deliver reports with intuitive, reliable, and user-friendly report designers and controls. Features include the ability to create reports in a variety of formats, such as PDF, Excel, and HTML. ActiveReports.NET is also highly customizable, with an extensive API and advanced feature library.
ActiveReports.NET v18 brings robust theme support to its JS Viewer and Web Designer components, granting you extensive control over the user interface. Choose from a diverse selection of built-in UI themes for instant customization, or exercise fine-grained control by creating your own theme. This allows you to precisely match the components' appearance with your application's unique branding, ensuring a visually cohesive and professional user experience.
To see a full list of what's new in version 18, see our release notes.
ActiveReports.NET is licensed per developer and is available with or without a 12 month support and maintenance subscription. See our ActiveReports.NET licensing page for full details.
For more information, visit our ActiveReports.NET product page.

A range trackbar component, also known as a range slider, expands upon the standard trackbar by allowing users to select a range of values within a predefined minimum and maximum, instead of just a single point. This is achieved through two independent sliders or markers that define the lower and upper bounds of the chosen range. Range trackbars are commonly used in applications requiring filter selection, price range specification, or any scenario where choosing a continuous segment within a broader spectrum is necessary.
Several Blazor Data Editor controls offer range trackbars including:
For an in-depth analysis of features and price, visit our Blazor data editors comparison.
Tel: (888) 850 9911
Fax: +1 770 250 6199


