













Fornecedor oficial
Como distribuidores oficiais e autorizados, nós fornecemos licenças legítimas diretamente de mais de 200 editores de software.
Ver todas as nossas marcas.
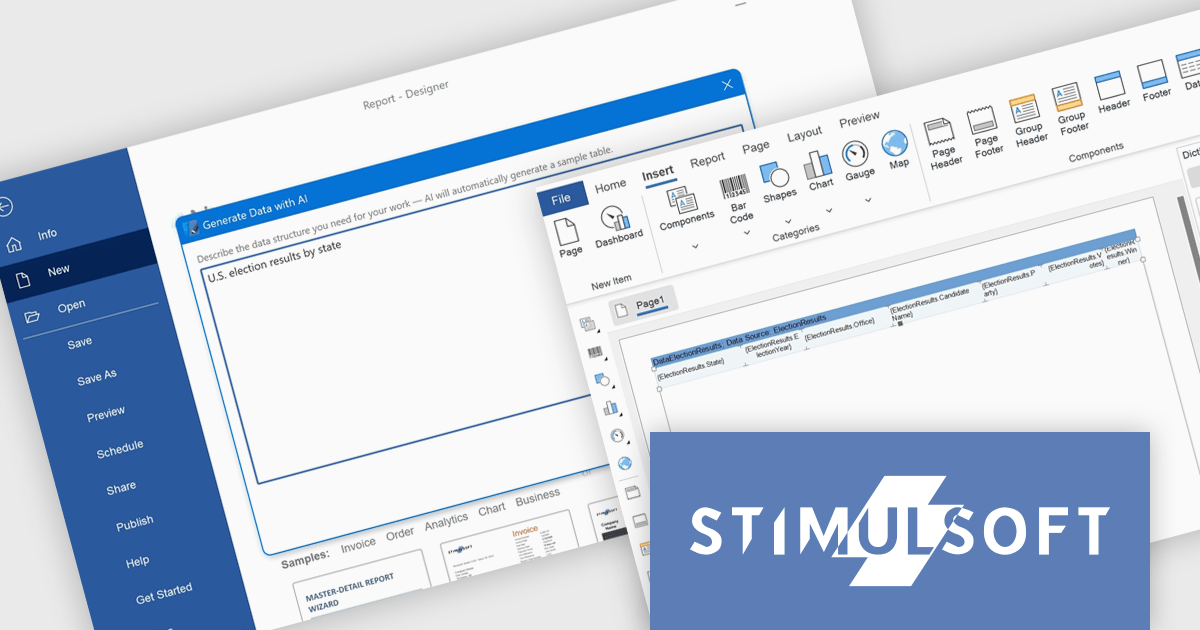
Stimulsoft Dashboards.WIN is a versatile suite of tools for crafting interactive data visualizations for web and desktop applications. It empowers developers to embed intuitive dashboards across various platforms, using platform-specific components or a centralized cloud designer. With data analysis elements, customization options, and pre-built templates, Stimulsoft Dashboards helps you transform complex data into clear, actionable insights for any audience.
The latest Stimulsoft Dashboards.WIN update introduces AI-powered data generation, enabling developers to quickly create realistic sample datasets using natural language prompts directly within the report designer. This improves the prototyping process by removing the need for manual data setup or external demo files, allowing for faster iteration, testing, and visualization of report layouts.
Stimulsoft Dashboards.WIN is licensed per developer and is available as a perpetual license with 1 year support and maintenance. See our Stimulsoft Dashboards.WIN licensing page for full details.
Stimulsoft Dashboards.WIN is available individually or as part of Stimulsoft Ultimate.
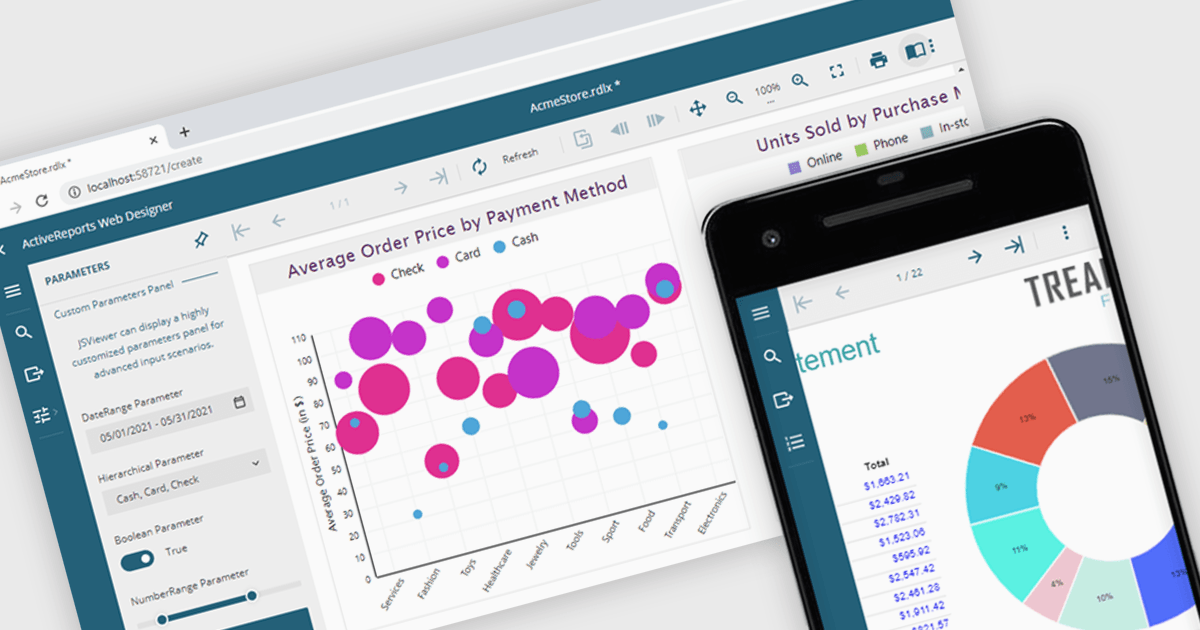
A JavaScript report viewer in a .NET reporting component is a client-side web interface that allows users to view, navigate, and interact with reports generated by a .NET-based reporting engine. It enables embedding of reports into web applications built with JavaScript frameworks such as Angular, React, or Vue, while relying on the .NET backend to handle report generation and data processing. This setup allows developers to deliver responsive, interactive report viewing experiences within modern browser environments, without requiring full-page reloads or complex server-side rendering.
Several .NET reporting controls feature a JavaScript report viewer including:
For an in-depth analysis of features and price, visit our comparison of .NET reporting controls.
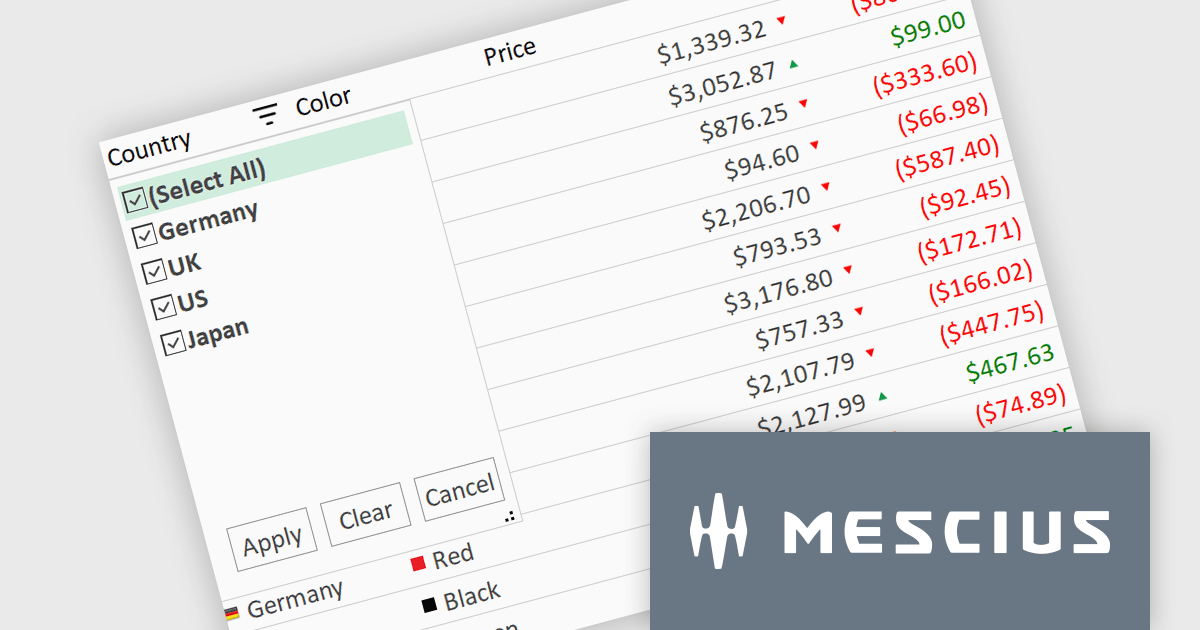
ComponentOne Studio WinForms by MESCIUS is a comprehensive toolkit offering over 120 advanced UI components to streamline Windows Forms application development. It empowers you to build visually appealing and feature-rich applications with functionalities like data visualization through charts and reports, intuitive data editing with performant grids, and modern UI elements including ribbons and docking for a user-friendly experience.
The ComponentOne Studio WinForms 2025 v1 maintenance update refines the FlexGrid Filter UI by making the dropdown more compact, allowing it to fit more efficiently within tight interface layouts. This adjustment improves the overall usability of the grid, particularly in data-heavy applications where screen space is limited. By streamlining the visual footprint of the filter interface, developers can deliver cleaner, more focused user experiences without compromising functionality, making it easier for end users to interact with and analyze data effectively.
To see a full list of what's new in 2025 v1 maintenance release, see our release notes.
ComponentOne Studio WinForms is licensed per developer on a perpetual basis and includes a 12 month subscription. Priority Support is also available. See our ComponentOne Studio WinForms licensing page for full details.
Learn more on our ComponentOne Studio WinForms product page.
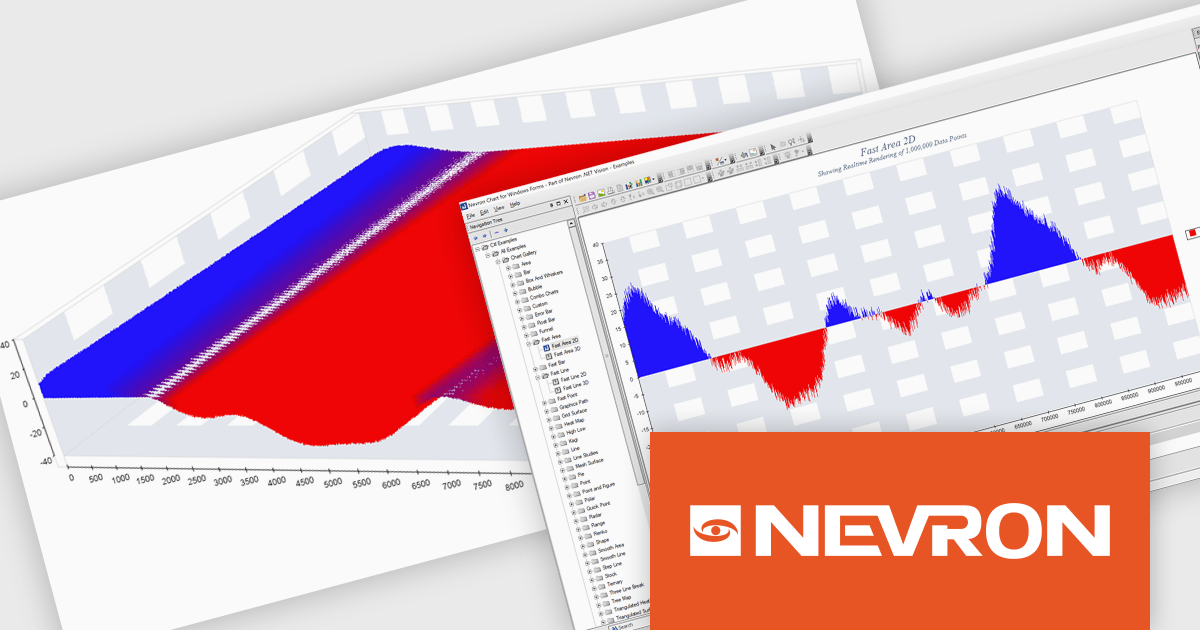
Nevron Chart for .NET is an advanced component suite designed for developers to add rich charting functionality to WinForms, WPF, ASP.NET and MVC applications. Covering any data visualization requirements it is an ideal solution for developing charting enabled presentation, business, scientific or financial applications. It boasts hardware acceleration for optimal performance, a flexible API for customization, and advanced interactivity features like zooming, panning, and tooltips to enhance user engagement with your data.
The Nevron Chart for .NET 2025.1 update introduces the new 'NFastAreaSeries', enabling real-time rendering of millions of data points using GPU acceleration. This addition significantly enhances performance for area charts, making it well-suited for high-volume data visualization scenarios. It complements existing fast-rendering series and includes optimizations that improve rendering efficiency across both imperial and metric units. Combined with automatic culture-based unit selection, the update ensures a responsive and localized user experience for developers building advanced data visualization applications.
To see a full list of what's new in 2025.1, see our release notes.
Nevron Chart for .NET is licensed per developer machine and is available as a perpetual license with 1 year subscription and support. See our Nevron Chart for .NET licensing page for full details.
Nevron Chart for .NET is available to buy in the following products:
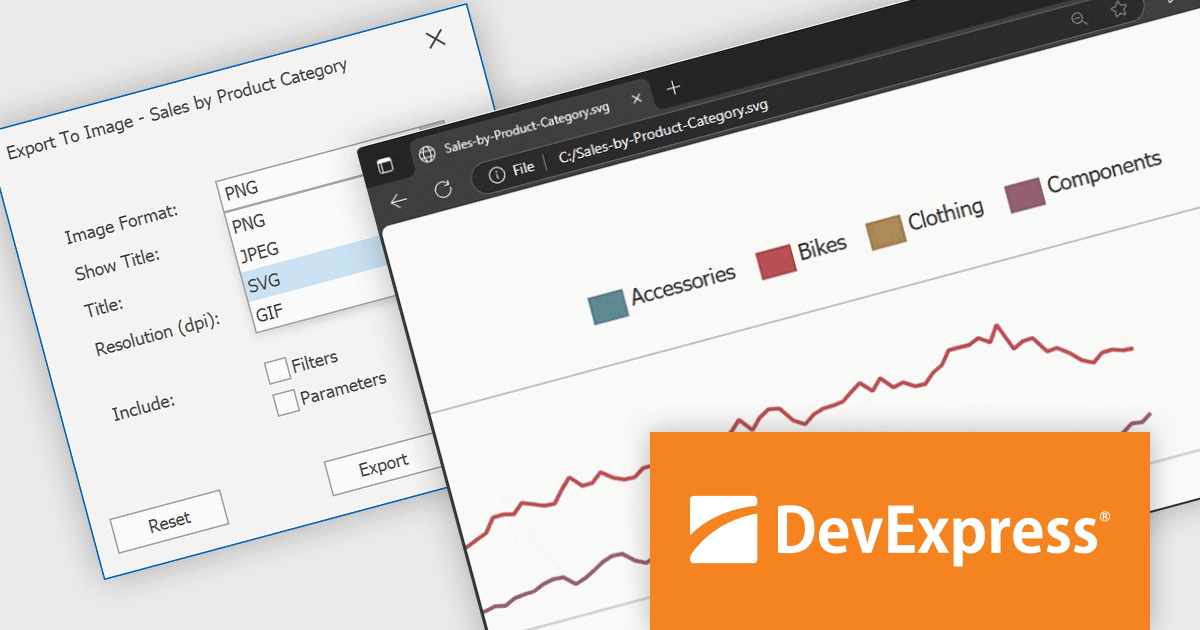
DevExpress BI Dashboard (part of DevExpress Universal) empowers you to craft interactive dashboards for desktop, web and mobile applications. It provides a visual designer for building dashboards without writing code, allowing you to drag-and-drop various data visualization widgets onto the canvas. These widgets connect to your data sources and update dynamically, offering real-time insights to end users. The tool also supports customization through properties and events, enabling you to tailor the look and feel of the dashboards to perfectly integrate with your application's design.
The DevExpress BI Dashboard v25.1 update adds support for exporting entire dashboards, specific items, or tab pages to Scalable Vector Graphics (SVG) format. This enhancement allows users and analysts to create resolution-independent, high-quality exports that maintain clarity at any size. SVG output is particularly useful for printed reports, shared presentations, or integration into documentation, where visual fidelity is essential.
To see a full list of what's new in version 25.1, see our release notes.
DevExpress BI Dashboard is included as part of DevExpress Universal which is licensed per developer and is available as a Perpetual License with a 12 month support and maintenance subscription. See our DevExpress Universal licensing page for full details.
DevExpress BI Dashboard is available in the following products:
Tel: (888) 850 9911
Fax: +1 770 250 6199


