


Fornecedor oficial
Como distribuidores oficiais e autorizados, nós fornecemos licenças legítimas diretamente de mais de 200 editores de software.
Ver todas as nossas marcas.
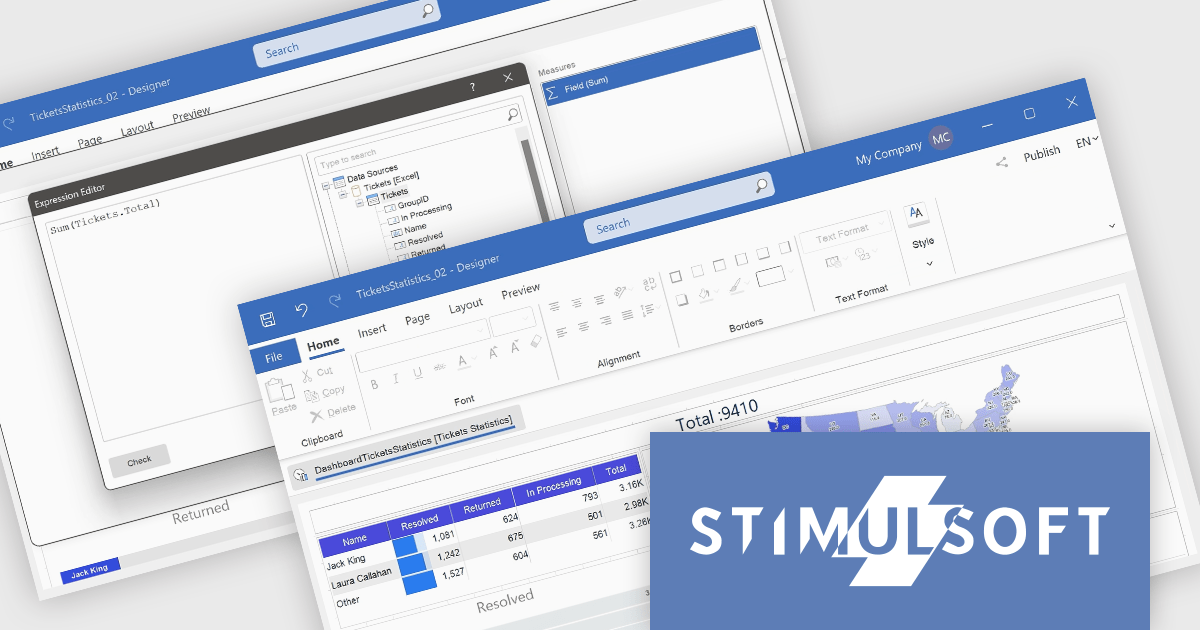
Stimulsoft Dashboards.WEB is a versatile suite of tools for crafting interactive data visualizations for web and desktop applications. It empowers developers to embed intuitive dashboards across various platforms, using the platform-specific components or a centralized cloud designer. With rich data analysis elements, extensive customization options, and pre-built templates, Stimulsoft Dashboards helps you transform complex data into clear, actionable insights for any audience.
The Stimulsoft Dashboards.WEB 2024.4.1 release adds the ability to create Measures within the Text dashboard element, which significantly enhances the flexibility and functionality of dashboards by allowing users to dynamically incorporate calculated values into text elements. This feature enables more informative and contextualized reports, as users can seamlessly display and update relevant metrics directly within the text, eliminating the need for separate data visualization components. This not only streamlines dashboard creation but also improves data accessibility and understanding for end-users.
To see a full list of what's new in 2024.4.1, see our release notes.
Stimulsoft Dashboards.WEB is licensed per developer and is available as a perpetual license with 1 year support and maintenance. See our Stimulsoft Dashboards.WEB licensing page for full details.
Stimulsoft Dashboards.WEB is available in the following products:
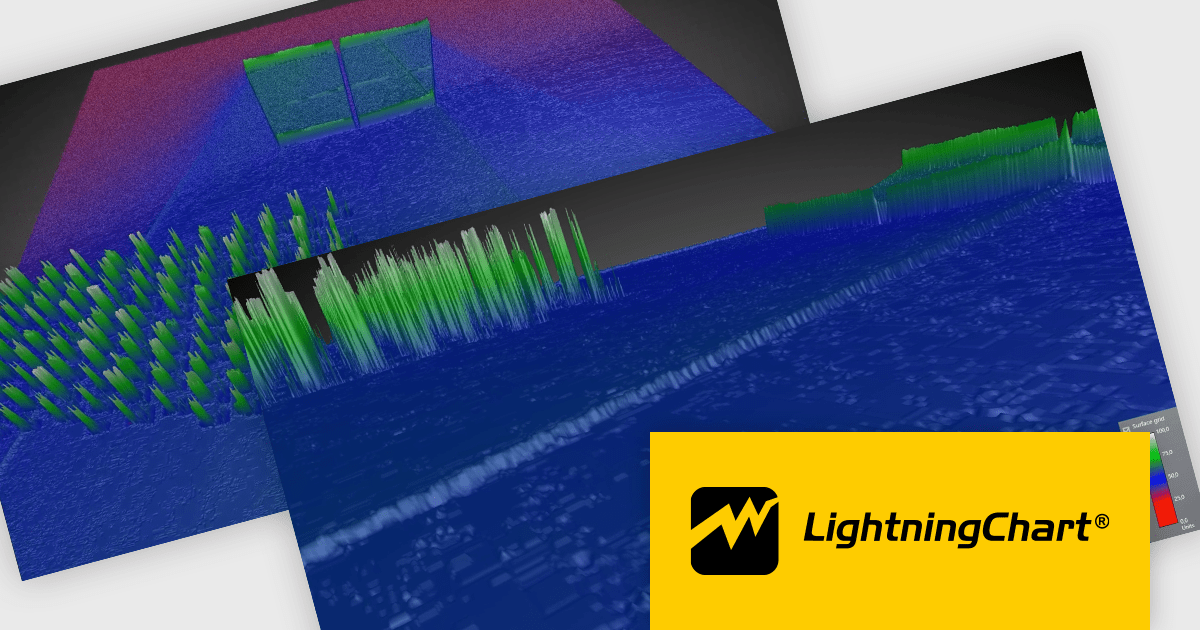
LightningChart .NET is a high-performance data visualization library designed for .NET developers working with WPF, WinForms, and UWP applications. It offers GPU-accelerated rendering for smooth real-time visualization of massive datasets, exceeding billions of data points. This library supports a wide variety of chart types, including 2D, 3D, polar, and geographic maps, along with extensive customization options for each. LightningChart .NET is a powerful tool for developers creating demanding data visualization applications requiring exceptional performance.
The LightningChart .NET v12.1.1 update delivers a substantial performance boost to 3D interactions, particularly for large surface-rendering objects such as SurfaceGridSeries3D, SurfaceMeshSeries3D, and MeshModel. This improvement allows for faster zooming, rotating, and panning, significantly enhancing the efficiency of workflows involving complex 3D models. Developers working on mid-level systems will experience at least double the performance, while high-end graphics setups can achieve up to a tenfold increase in speed. These optimizations enable smoother and more responsive interaction with large datasets, leading to more productive and seamless user experiences when working in demanding 3D environments.
To see a full list of what's new in v12.1.1, see our release notes.
LightningChart .NET is available per developer in packages for either WPF, WinForms, UWP or all 3. Each package comes as a subscription license (with 1 or 2 years of limited support), or a perpetual license (with 1 or 2 years of Standard or Premium support). Floating licenses and site licenses are available upon request. See our LightningChart .NET licensing page for full details.
Learn more on our LightningChart .NET product page.
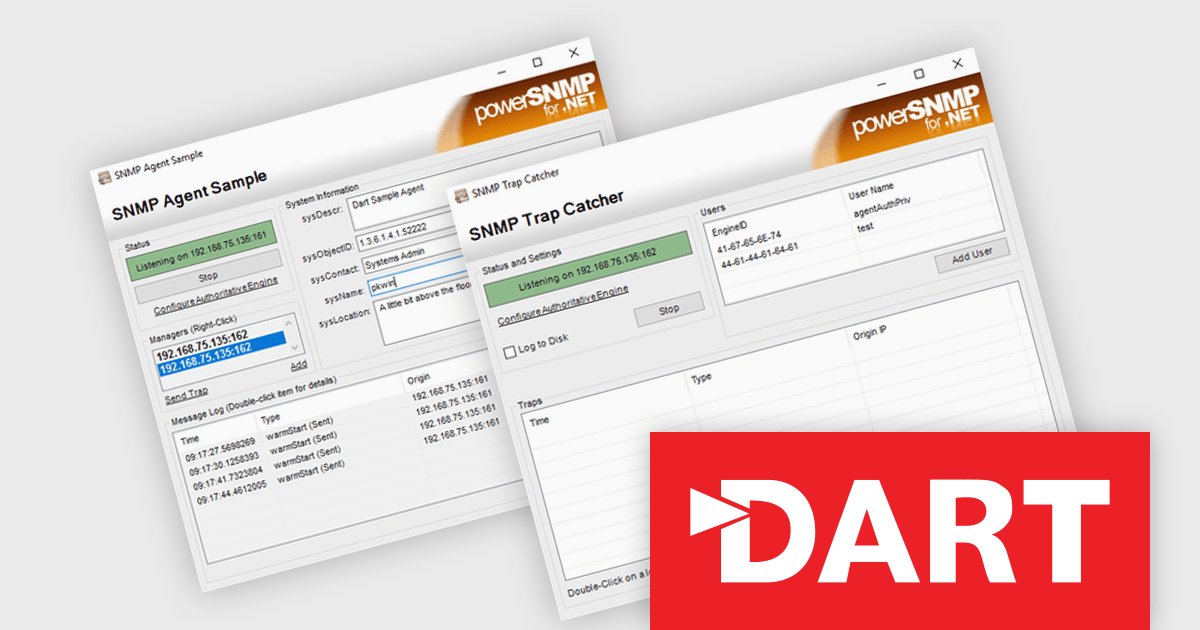
PowerSNMP for .NET is a comprehensive .NET library that provides a robust interface for interacting with SNMP (Simple Network Management Protocol) devices. It offers a wide range of functionalities, including managing SNMP agents, retrieving and setting MIB (Management Information Base) variables, trapping, and configuring SNMP security mechanisms. By leveraging PowerSNMP for .NET, developers can efficiently integrate SNMP capabilities into their .NET applications, enabling them to monitor and control network devices effectively.
The PowerSNMP for .NET 8.0 release adds the AesKeyExpansionAlgorithm property to the User object, enabling the selection of a key expansion algorithm for each user when using AES192 or AES256 encryption with less secure authentication algorithms like SHA-1 or MD5. When processing incoming messages, the chosen algorithm will be prioritized, and if it fails, a fallback to the secondary algorithm will occur. Should both attempts be unsuccessful, an exception will be raised. This enhancement provides greater control and flexibility in managing encryption security on a per-user basis.
To see a full list of what's new in 8.0.0.0, see our release notes.
PowerSNMP for .NET is licensed per developer and is available as a perpetual license with 12 months subscription (product updates and priority email support). See our PowerSNMP for .NET licensing page for full details.
Learn more on our PowerSNMP for .NET product page.
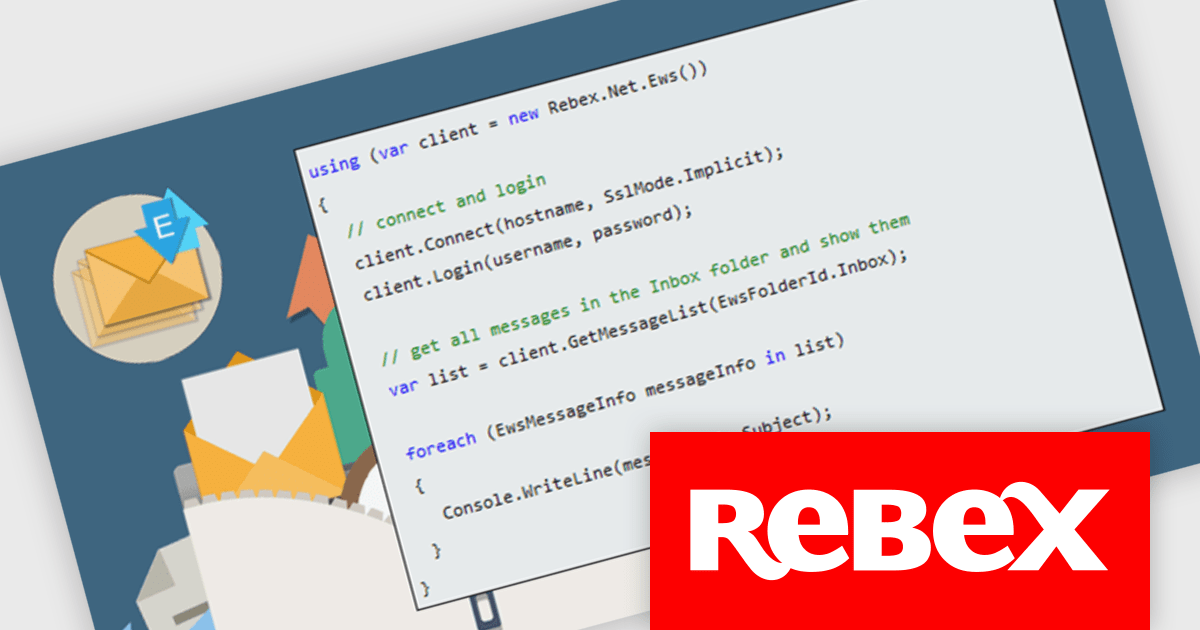
Rebex EWS is a powerful .NET library that simplifies interaction with Microsoft Exchange servers, enabling seamless management of emails, contacts, and calendars. With a secure, developer-friendly API, it ensures robust TLS 1.3/1.2 and S/MIME support, while flexible SMTP integration allows effortless email delivery. Designed for efficiency, Rebex EWS handles high loads and large datasets, making it an ideal choice for developers seeking reliable Exchange integration in their .NET applications.
Rebex EWS simplifies the integration of Microsoft Exchange into .NET applications, its efficient performance makes it ideal for handling large datasets and high-volume environments. Use cases include automating email workflows, syncing calendars, managing contact directories, and integrating secure communication into enterprise systems, making Rebex EWS a versatile choice for modern applications.
Rebex EWS is licensed per developer. All new licenses include a 1 year support contract which includes priority support and all software updates during the support period. Support contract renewals are also available. See our Rebex EWS licensing page for full details.
Rebex EWS is available in the following products:
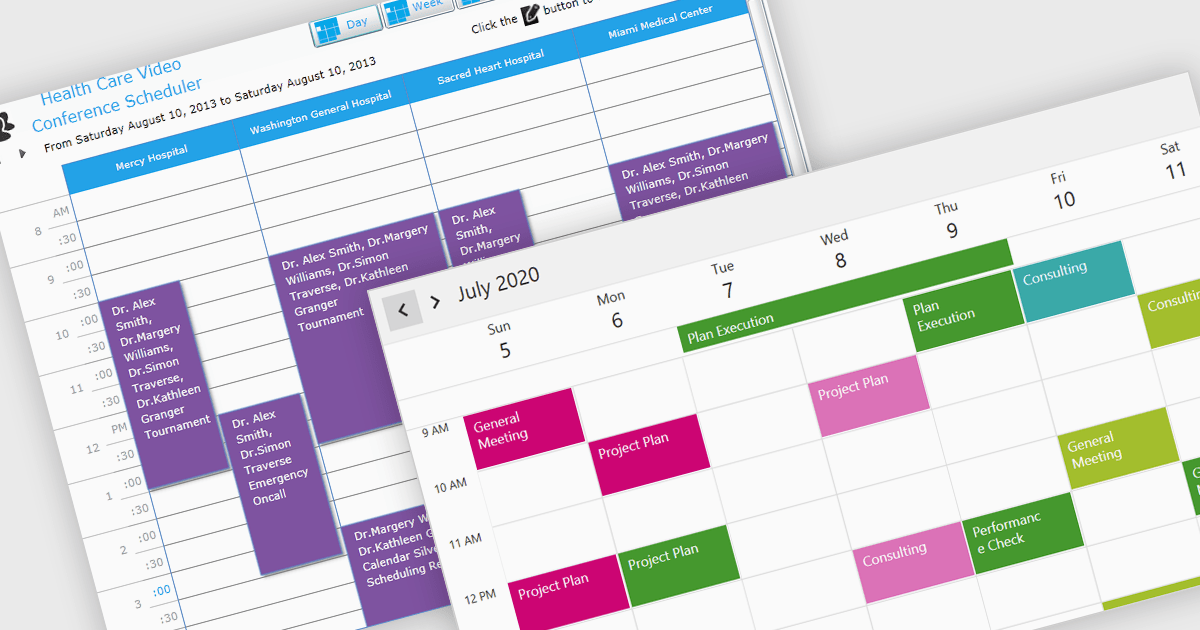
A calendar view in a scheduling component provides users with versatile tools for managing time across various scales. With options like Day, Week, Month, Agenda, and Year views, users can easily switch between detailed daily scheduling and long-term planning. These views offer tailored insights to meet immediate priorities, track events, and plan strategically, making them ideal for professionals, teams, and organizations needing both precision and big-picture control. The flexibility of these views helps optimize productivity, ensuring tasks are completed on time while aligning with broader goals.
Several .NET products offer scheduling components with calendar view support including:
Explore our range of .NET calendar and scheduling components.
Need help to find the right software license, upgrade or renewal? Call, Email, or Live Chat with our experts.
Tel: (888) 850 9911
Fax: +1 770 250 6199


