













Fornecedor oficial
Como distribuidores oficiais e autorizados, nós fornecemos licenças legítimas diretamente de mais de 200 editores de software.
Ver todas as nossas marcas.
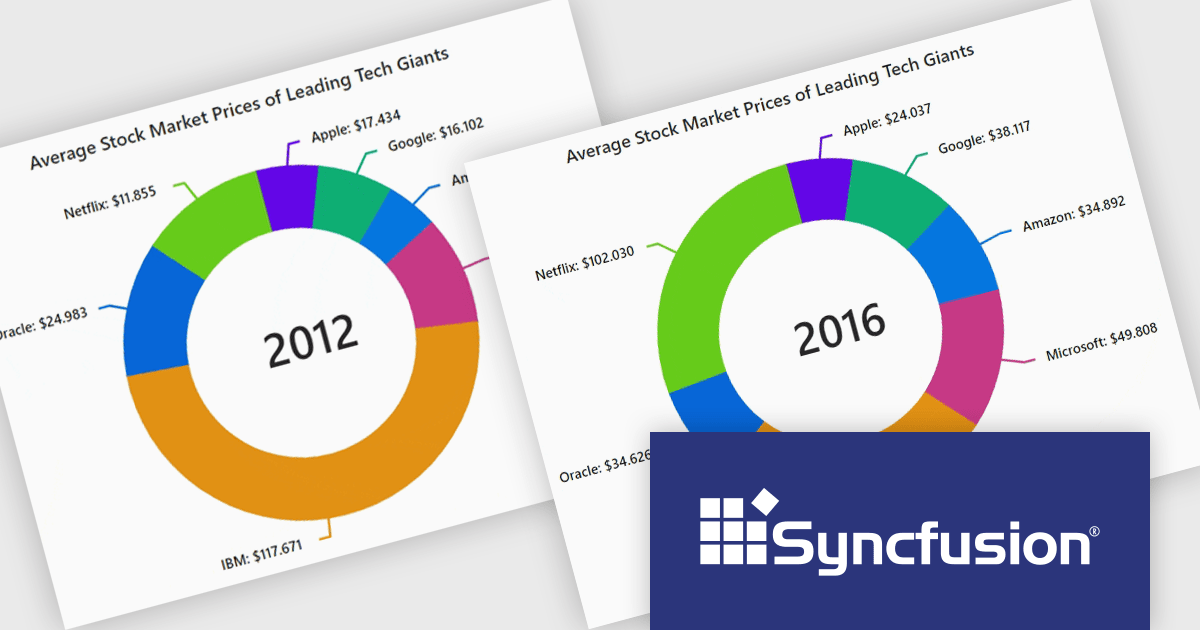
Syncfusion Essential Studio JavaScript, available as part of Syncfusion Essential Studio Enterprise, is a comprehensive UI library offering over 80 high-performance, lightweight, and responsive components to transform your web apps. Built from scratch with TypeScript, it boasts modularity and touch-friendliness, letting you pick and choose specific features while ensuring smooth mobile interaction. With rich themes, global accessibility features, and extensive documentation, it powers everything from basic buttons to interactive charts and data grids, simplifying frontend development across JavaScript, Angular, React, and Vue.
The Syncfusion Essential Studio JavaScript 2024 Volume 3 release adds the new accumulation charts animation feature which significantly enhances the user experience with smooth transitions. This creates a more dynamic and visually engaging interface, allowing users to interact with charts in real-time without abrupt changes. The fluid animations extend to series, data labels, and legends, providing a cohesive and polished look that improves the overall clarity and understanding of data updates. By reducing visual disruption, this feature makes data-driven insights more accessible and keeps users focused on the evolving information.
To see a full list of what's new in version 2024 Volume 3, see our release notes.
Syncfusion Essential Studio JavaScript is available as part of Syncfusion Essential Studio Enterprise which is licensed per developer starting with a Team License of up to five developers. It is available as a 12 Month Timed Subscription License which includes support and maintenance. See our Syncfusion Essential Studio Enterprise licensing page for full details.
For more information, visit our Syncfusion Essential Studio JavaScript product page.
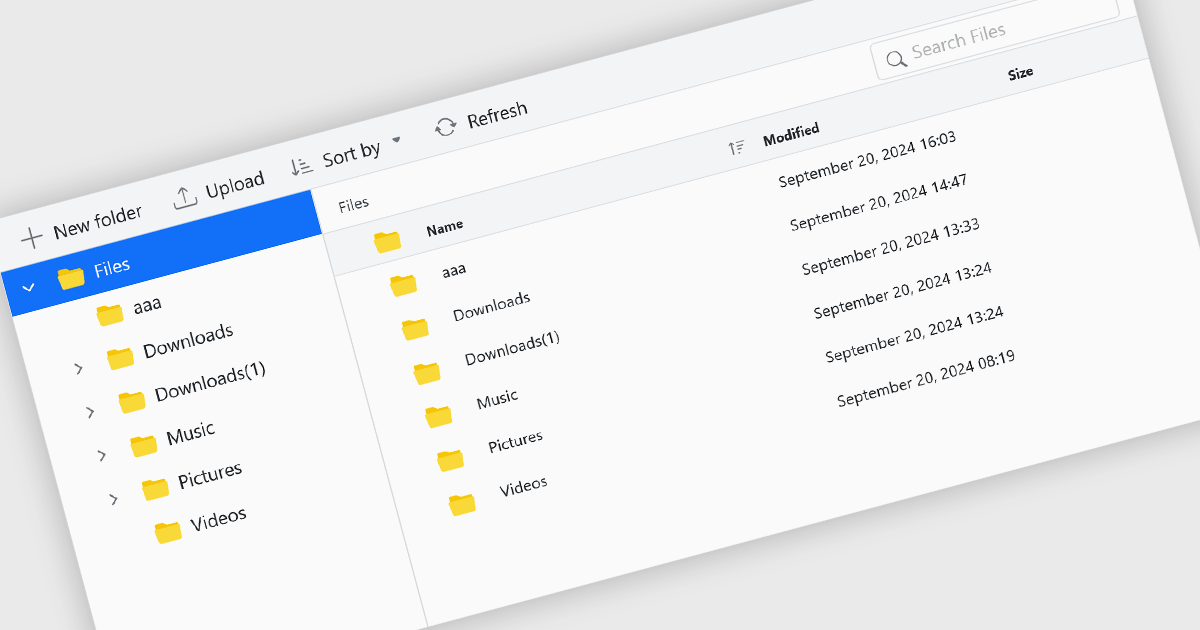
File management components, such as file explorers, uploaders, and downloaders, are essential elements in UI suites as they facilitate seamless interaction with files and data. These components enable users to efficiently organize, access, and manipulate files within an application, enhancing productivity and usability. By providing intuitive and user-friendly interfaces for file operations, these components contribute to a positive and efficient user experience.
Several ASP.NET Core UI suites offer file management controls including:
For an in-depth analysis of features and price, visit our ASP.NET Core UI suites comparison.
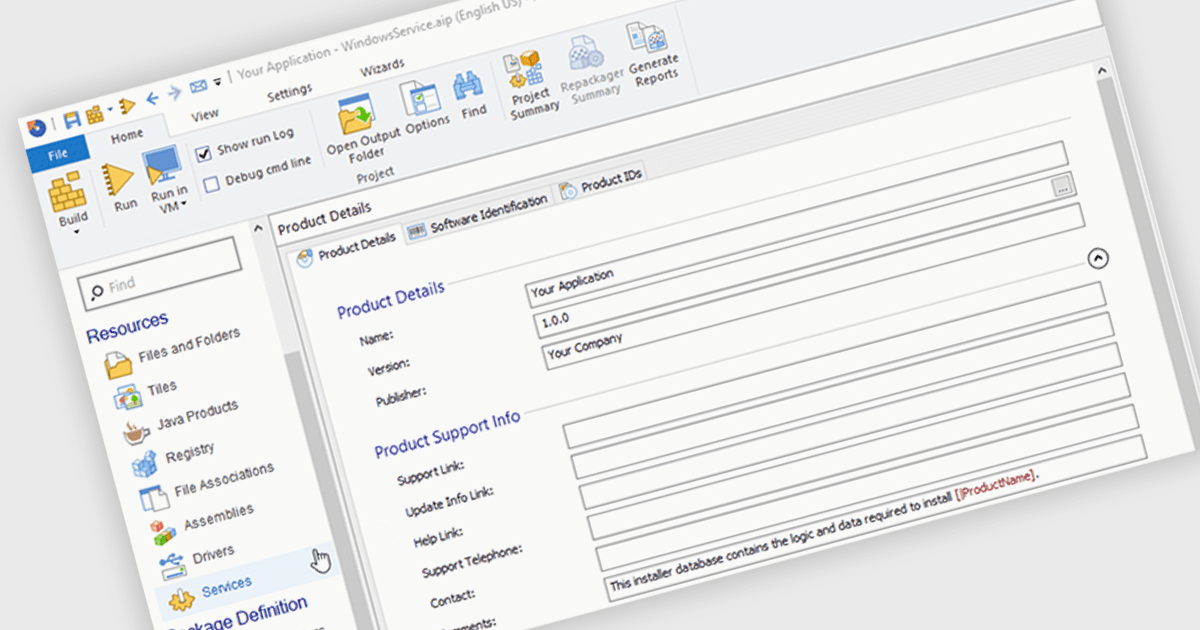
An installation tool with support for Windows services can automatically create and set up Windows services during the installation process. This functionality allows developers to automate the deployment of background tasks that run independently of user interactions. By integrating service installation into the installation process, developers can ensure that necessary services are started and running correctly after the application is installed, streamlining the setup and configuration process for both users and administrators.
Several installation tools offer support for installing Windows services including:
For an in-depth analysis of features and price, visit our comparison of Installation Tools.
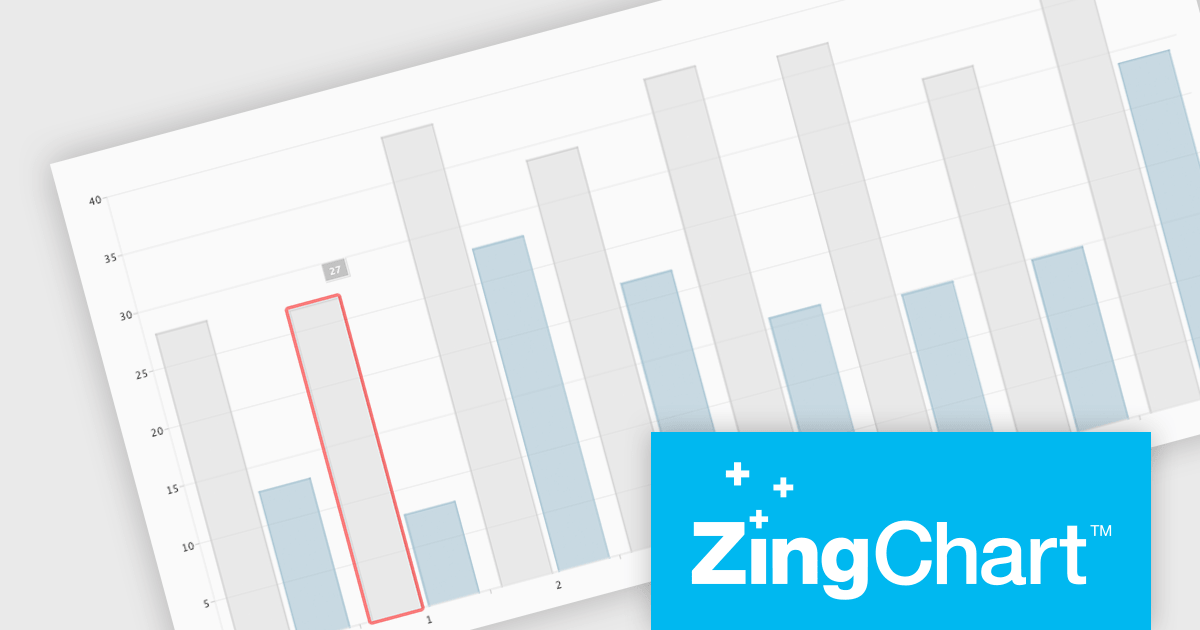
ZingChart is a powerful data visualization tool that empowers businesses to transform raw data into actionable insights. With its extensive library of customizable charts and graphs, ZingChart allows users to create visually stunning and interactive visualizations. Key features include real-time updates, data binding, and integration with popular programming languages and frameworks. By leveraging ZingChart, organizations can gain deeper understanding of their data, identify trends, and make data-driven decisions to improve efficiency and achieve business objectives.
The ZingChart 2.9.15 release improves inclusivity and accessibility. With the addition of robust keyboard navigation and speech support, users can now interact with charts effortlessly, regardless of their visual or motor abilities. By simply using their keyboard or screen reader, individuals can explore, analyze, and understand data visualization elements with ease. This significant enhancement ensures that ZingChart is a valuable tool for everyone, promoting inclusivity and accessibility in data visualization.
To see a full list of what's new in 2.9.15, see our release notes.
ZingChart is licensed on an annual or perpetual basis. It has several license options including Website, Internal, Service (SaaS), Enterprise and OEM. See our ZingChart licensing page for full details.
Learn more on our ZingChart product page.
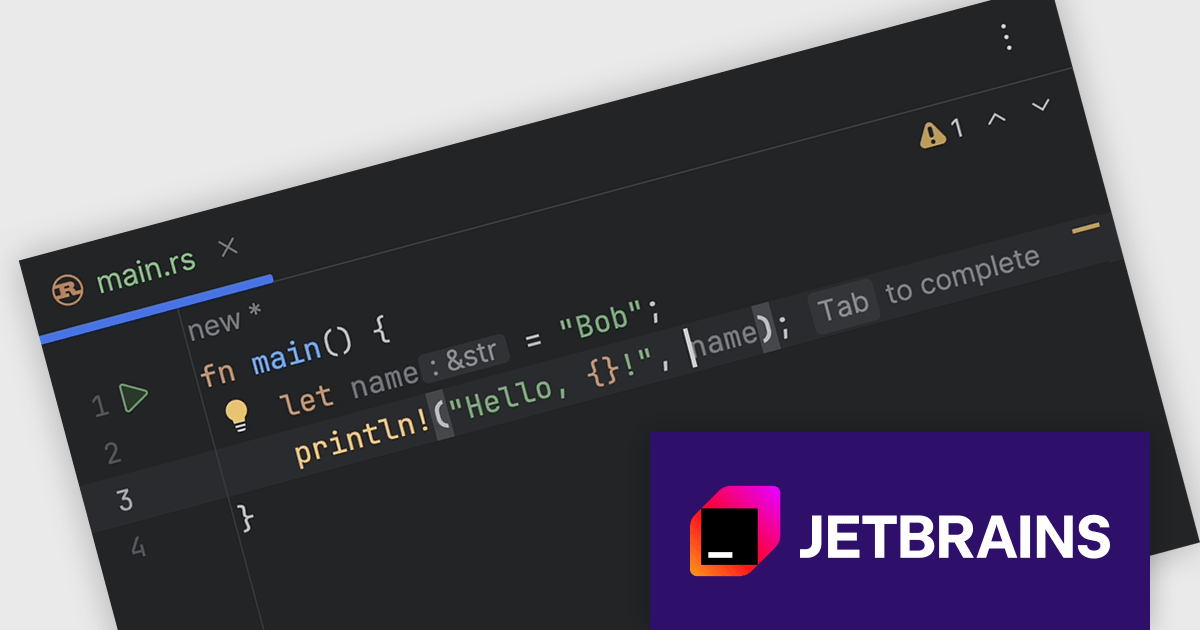
RustRover by JetBrains is a Integrated Development Environment designed specifically for the Rust programming language. It provides a comprehensive set of tools for writing and editing Rust code, all within a single program. RustRover offers advanced features tailored to Rust development, making it a powerful tool for both beginners and experienced Rust programmers.
The RustRover 2024.2 release introduces full line code completion. This powerful tool utilizes a local deep learning model to suggest entire lines of Rust code, customized to the specific context of your current project. The text suggestions, appearing as complete statements, streamline your coding process and minimize the need for manual input. By offering intelligent and context-aware code suggestions, RustRover empowers you to write code faster, more accurately, and with greater efficiency.
To see a full list of what's new in 2024.2, see our release notes.
RustRover is licensed per user, and is available as a commercial annual subscription license. We can supply new subscriptions, subscription renewals (including continuity discounts), lapsed renewals, and additional user licenses. See our RustRover licensing page for full details.
RustRover is available to buy in the following products:
Tel: (888) 850 9911
Fax: +1 770 250 6199


