


Fornecedor oficial
Como distribuidores oficiais e autorizados, nós fornecemos licenças legítimas diretamente de mais de 200 editores de software.
Ver todas as nossas marcas.
ComponentOne Studio WinForms by MESCIUS is a comprehensive toolkit offering over 120 advanced UI components to streamline Windows Forms application development. It empowers you to build visually appealing and feature-rich applications with functionalities like data visualization through charts and reports, intuitive data editing with performant grids, and modern UI elements including ribbons and docking for a user-friendly experience.
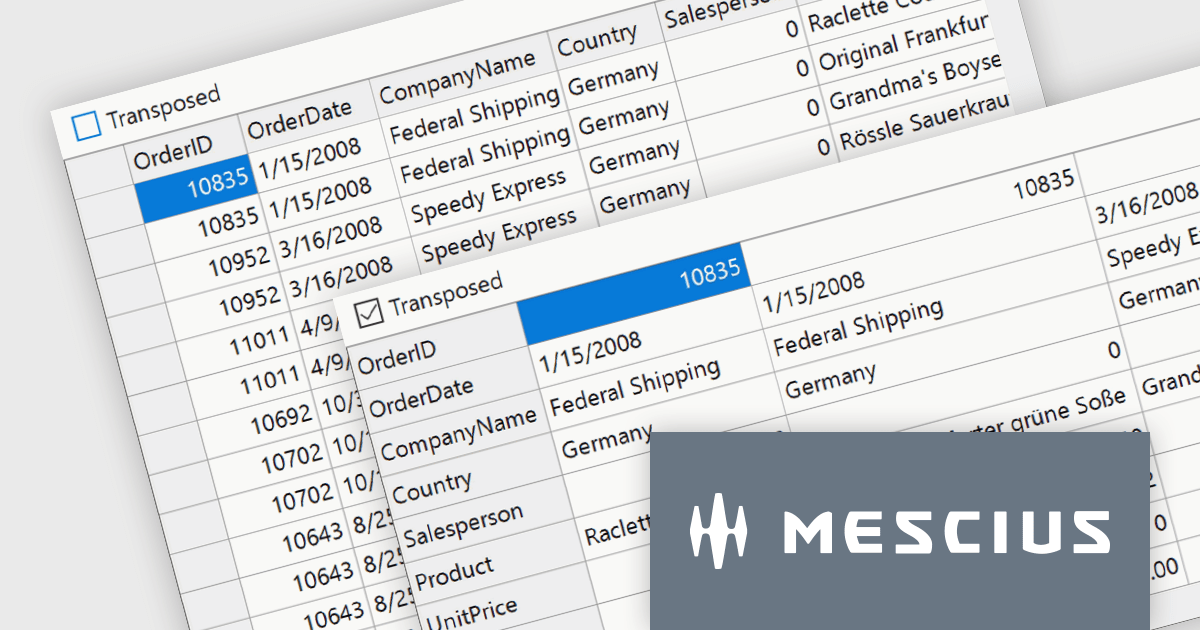
The ComponentOne Studio WinForms 2024 v1 update introduces a new Transposed datagrid view for FlexGrid, enhancing its data presentation capabilities. This feature allows you to display data with rows as columns and columns as rows, providing an alternative view for scenarios where you have many columns or want to prioritize specific data points. This can improve data readability and analysis, especially for wide datasets or when focusing on specific attributes across multiple records.
To see a full list of what's new in 2024 v1, see our release notes.
ComponentOne Studio WinForms is licensed per developer on a perpetual basis and includes a 12 month subscription. See our ComponentOne Studio WinForms licensing page for full details.
Learn more on our ComponentOne Studio WinForms product page.

Localization capabilities in PDF viewer components allow for a user-friendly experience across various languages. By providing translated text and right-to-left support for interface elements like menus, buttons, and error messages, viewers can navigate and interact with PDFs in their native language. This improves international accessibility and fosters a wider user base for applications that utilize PDF documents.
Several React PDF Viewer controls offer localization including:
For an in-depth analysis of features and price, visit our React PDF Viewer controls comparison.
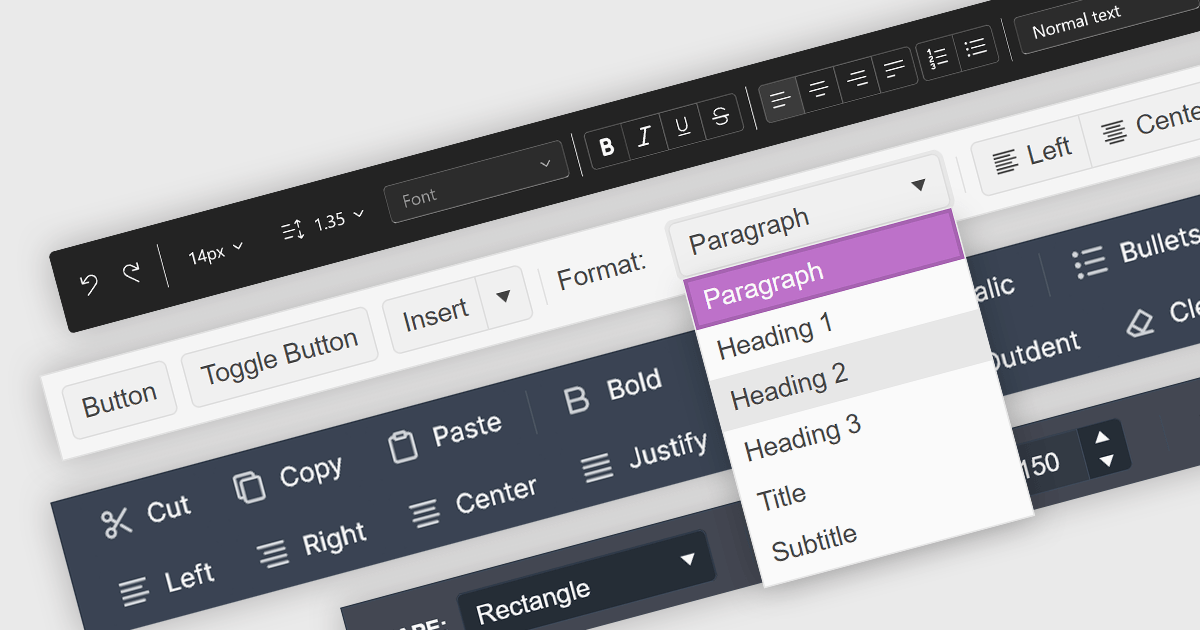
Toolbar controls for jQuery extend the functionality of your web applications by providing customizable toolbars with UI elements like buttons, dropdowns, and menus. These libraries offer features like drag-and-drop customization, theming options, and accessibility compliance, streamlining user interaction for common actions like editing, formatting, and navigation.
Several jQuery UI suites feature a toolbar control including:
For an in-depth analysis of features and price, visit our jQuery UI Suites comparison.
ComponentOne Studio Enterprise by MESCIUS is a comprehensive toolkit for .NET developers, offering a vast collection of pre-built UI controls for desktop (WinForms, WPF, WinUI, UWP), web (ASP.NET MVC, ASP.NET Core, MVC, Blazor), and mobile (.NET MAUI, Xamarin) applications. It extends functionality beyond UI with data visualization tools, data grids, reporting components, and JavaScript controls through Wijmo Enterprise. This all-in-one solution streamlines development by providing pre-designed elements and functionalities, allowing developers to focus on core application logic and deliver feature-rich applications faster.
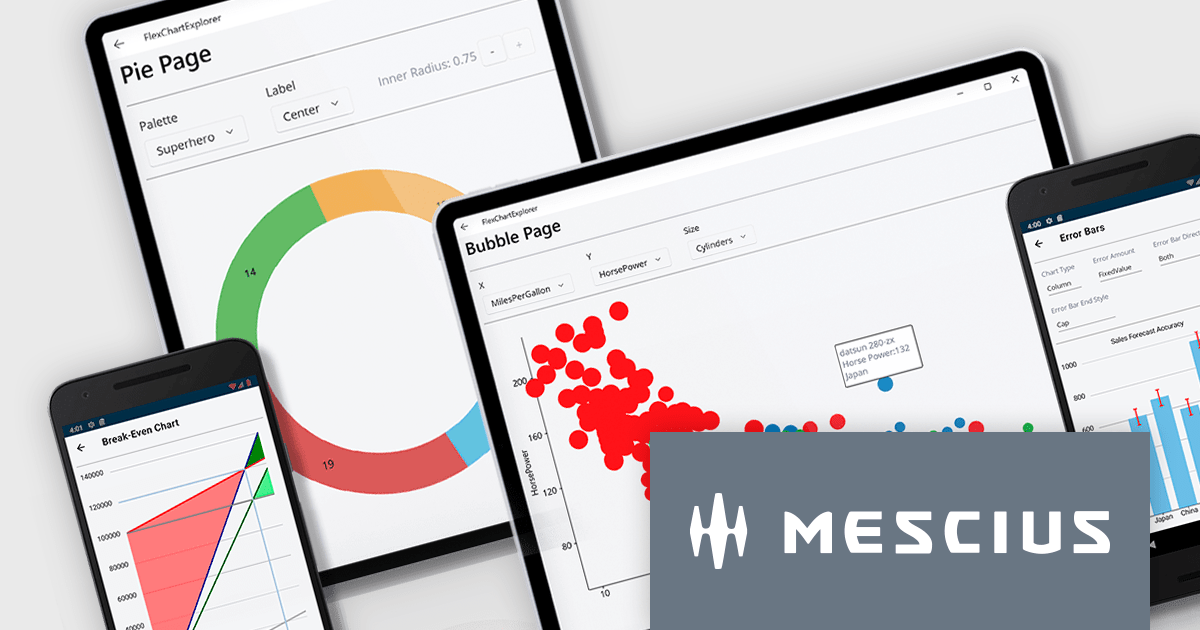
The ComponentOne Studio Enterprise 2024 v1 release adds ComponentOne MAUI FlexChart, a cross-platform .NET MAUI chart control, empowers you to craft dynamic dashboards and data visualizations. With over 50 chart types including bar charts, line graphs, pie charts, and combination plots, developers can tailor the perfect visual representation for your data. FlexChart offers granular control, allowing you to customize labels, gridlines, tick marks, and more. It enhances user engagement with interactive features like pop-up labels, selection, zoom, pan, and line markers. This powerful tool enhances the ability to present data insights in a clear and engaging way for .NET MAUI projects.
To see a full list of what's new in 2024 v1, see our release notes.
ComponentOne Studio Enterprise is licensed per developer on a perpetual basis and includes a 12 month subscription. Priority Support is also available. See our ComponentOne Studio Enterprise licensing page for full details.
Learn more on our ComponentOne Studio Enterprise product page.
MadCap Central, a cloud-based content experience management (CxM) platform by MadCap Software, offers software developers a centralized hub for managing the entire content development lifecycle. It streamlines tasks like version control, project management, and content collaboration, while also providing functionalities like automated publishing, content hosting, and output analytics. This integrated approach can significantly improve development team efficiency and content accuracy.
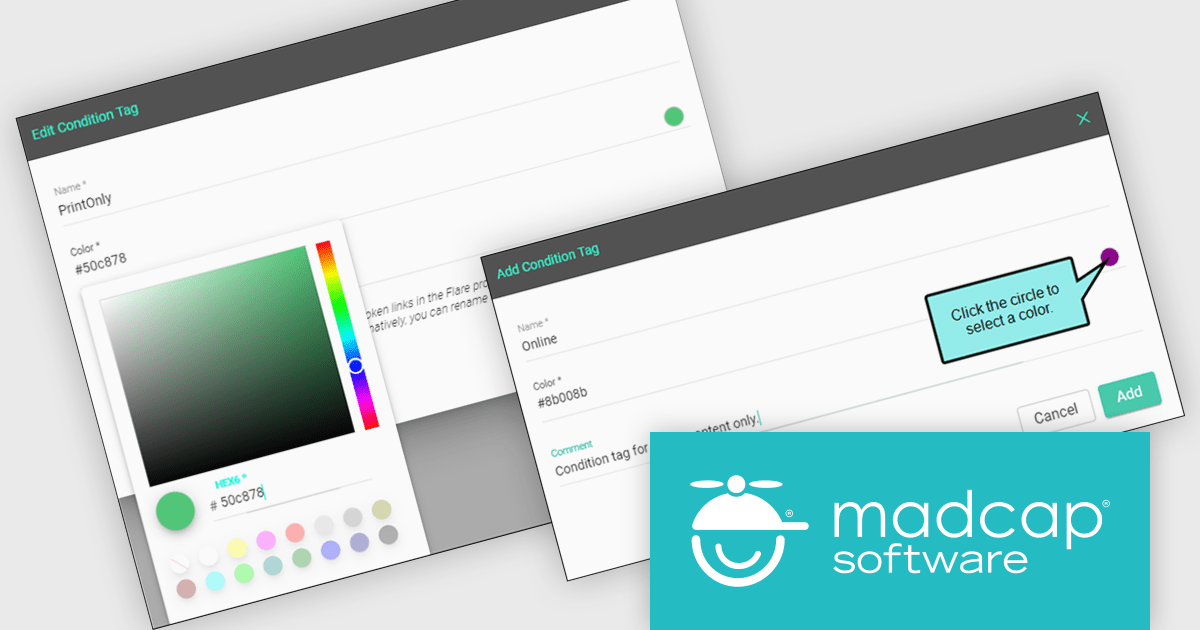
MadCap Central's June 2024 update empowers authors with greater control over content personalization through a new Conditions Editor. This feature transcends the previous ability to simply apply or remove existing conditions. Now, authors can directly create, edit, and manage conditions within the Content Editor itself. This eliminates the need for external tools or workarounds, allowing for more efficient and centralized control over what content appears in different outputs, on specific devices, or at various screen sizes.
To see a full list of what's new in the June 2024 update, see our release notes.
MadCap Central is licensed per user and is available as an annual license. See our MadCap Central licensing page for full details.
For more information, see our MadCap Central product page.
Tel: (888) 850 9911
Fax: +1 770 250 6199


