


Fornecedor oficial
Como distribuidores oficiais e autorizados, nós fornecemos licenças legítimas diretamente de mais de 200 editores de software.
Ver todas as nossas marcas.
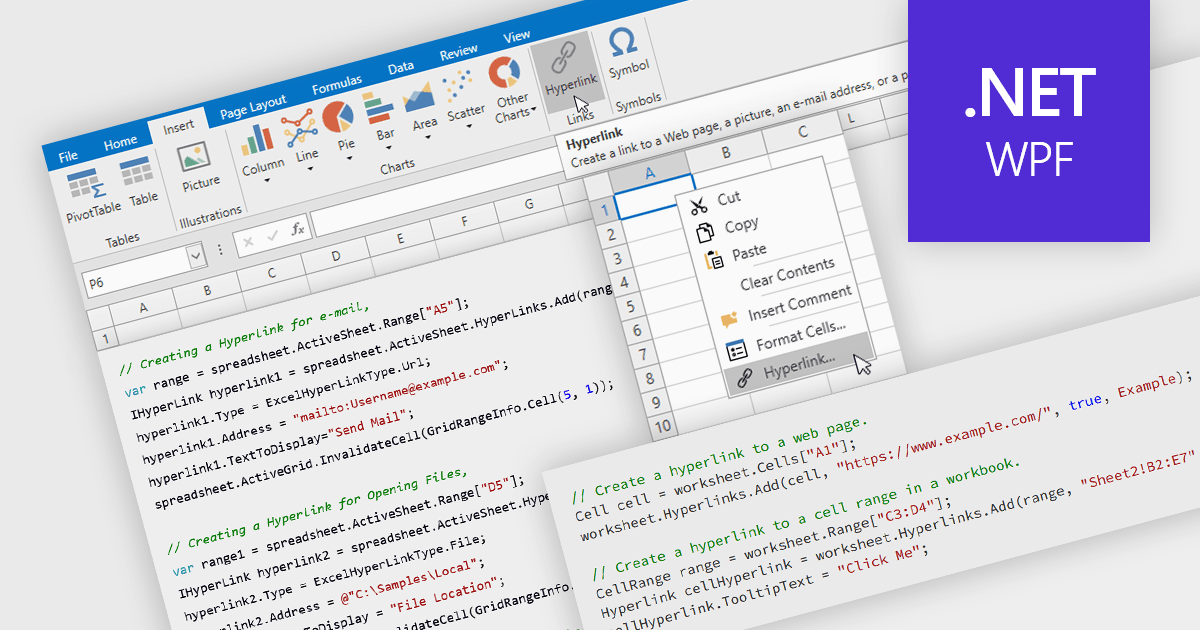
Hyperlink support in a spreadsheet allows a cell to reference an external resource, such as a web page, email address, file, or another location within the workbook. This capability enables users to connect data with relevant context, making it easier to navigate between related information and systems. By embedding links directly into cells, spreadsheets can serve not only as data stores but also as interactive interfaces, improving usability, reducing the need for manual lookup, and supporting more efficient processes across applications and datasets.
Several WPF spreadsheet components allow you to add hyperlinks within cells, including:
For an in-depth analysis of features and price, visit our comparison of WPF spreadsheet components.
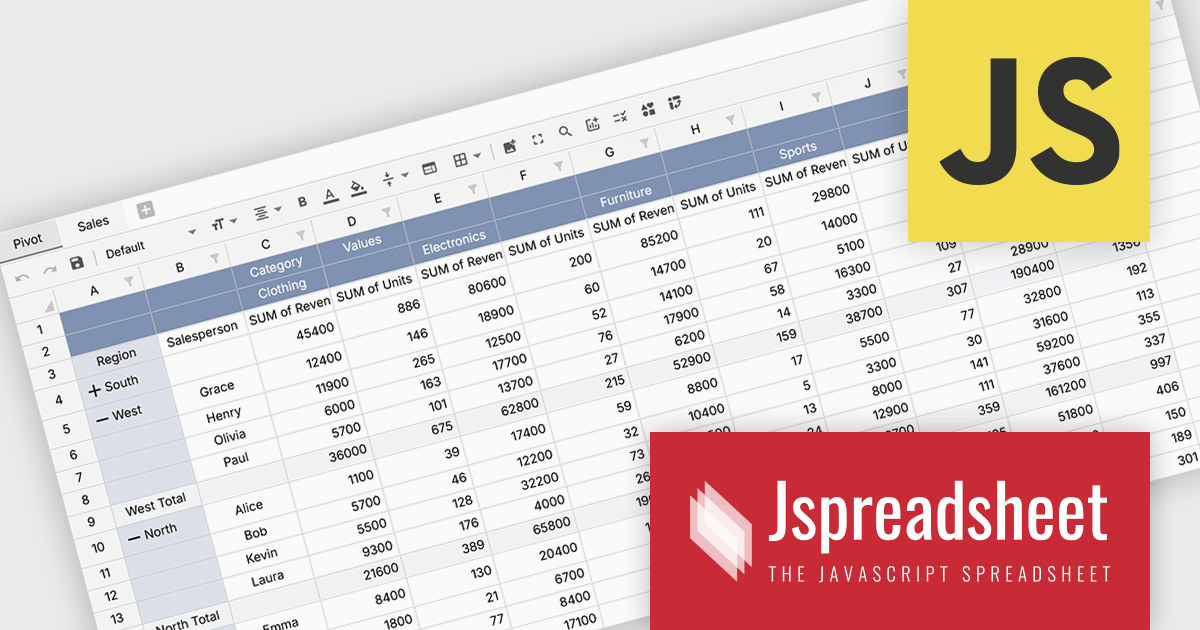
Jspreadsheet Pro is a flexible JavaScript-based spreadsheet solution that enables developers to create customizable, feature-rich data grids for web applications. It offers advanced formulas, data validation, and API integrations. Ideal for tasks like financial modeling, inventory management, and project tracking, it helps businesses efficiently manage and analyze data.
Jspreadsheet Pro introduces pivot table functionality that allows developers to summarize and analyze large datasets directly within browser based spreadsheet applications. It enables users to group data across multiple rows and columns, apply aggregation methods such as sum or average, and refine results through filtering and sorting. With built in spreadsheet formulas and cross worksheet references, developers can provide interactive data analysis capabilities without requiring external tools or additional backend processing.
Jspreadsheet Pro is licensed as an Annual or a Perpetual License with support and maintenance. We can supply any Jspreadsheet Pro license including new licenses, maintenance renewals, and upgrade licenses. See our Jspreadsheet Pro for full details.
For more information, visit our Jspreadsheet Pro product page.
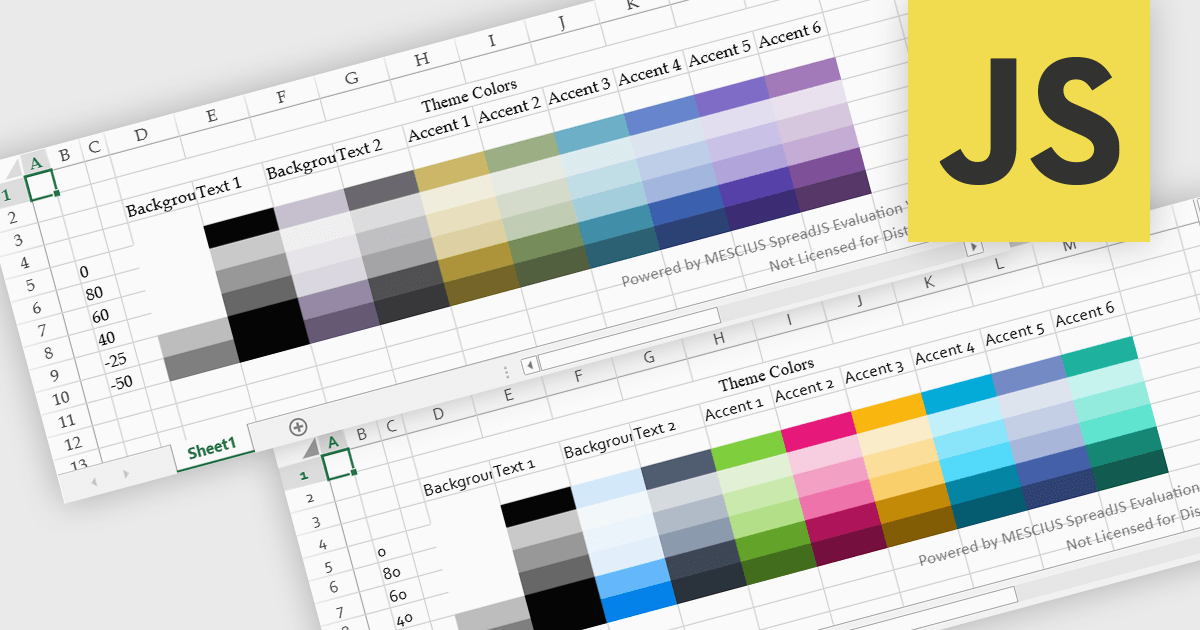
Spreadsheet themes provide a consistent visual style by applying coordinated colors, fonts, and formatting across an entire workbook. Instead of manually styling individual elements, users can quickly apply a theme to ensure tables, charts, and data ranges follow the same design. This improves readability, enhances data presentation, and helps maintain a professional and cohesive look across reports. Themes are particularly useful when creating business dashboards, financial reports, or shared team documents, where consistent formatting and clear visual hierarchy make data easier to interpret and align with company branding.
Several JavaScript spreadsheet controls offer support for applying themes including:
For an in-depth analysis of features and price, visit our JavaScript spreadsheet controls comparison.
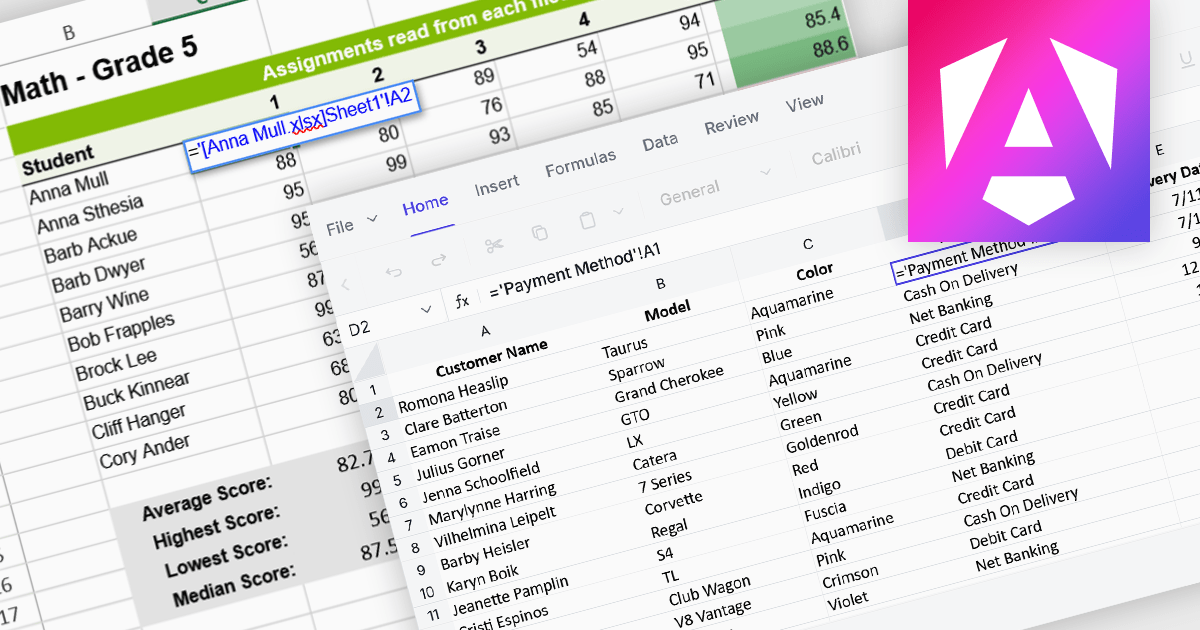
Cross-worksheet calculations allow spreadsheet components to reference and compute values across multiple sheets within the same workbook. This capability enables developers to build more advanced data models, where formulas can pull information from different worksheets to support summaries, aggregations, and linked analysis. By allowing data to be organized across separate sheets while remaining connected through formulas, applications can present complex datasets in a structured and scalable way without sacrificing calculation accuracy or performance.
Several Angular spreadsheet controls offer support for cross-worksheet calculations including:
For an in-depth analysis of features and price, visit our Angular spreadsheet controls comparison.
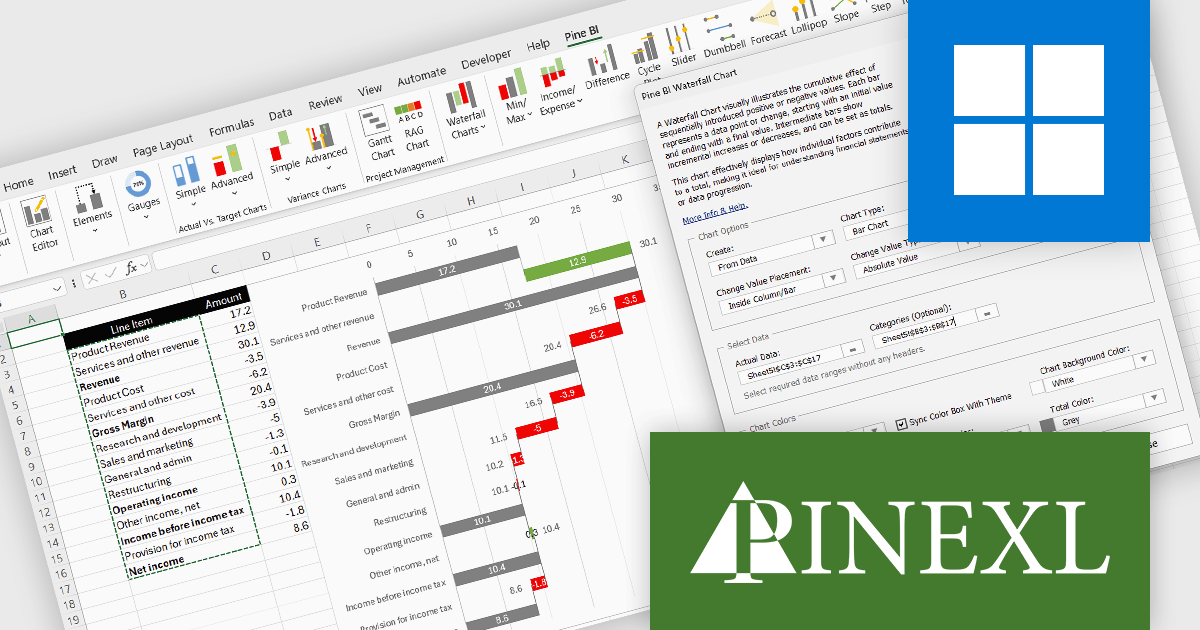
The Pine BI Excel Add-In facilitates the rapid generation of sophisticated and interactive Excel charts, enabling the transformation of standard workbooks into engaging dashboards that improve data visualization. These easily shareable visuals can also be integrated into Microsoft Word and PowerPoint, improving the creation of impactful reports and presentations across various business applications.
The Pine BI Excel Add-In v2.1 update improves waterfall chart functionality by introducing rebuilt formulas that support a cleaner and more consistent data structure. Instead of relying on automatically calculated totals that required blank fields, developers can now explicitly define which values act as totals within the dataset. This approach simplifies data preparation, removes the need for automatic final totals, and makes chart calculations more transparent and predictable. As a result, developers can create and maintain waterfall visualizations more efficiently, particularly when working with complex financial or analytical models.
To see a full list of what's new in v2.1, see our release notes.
Pine BI Excel Add-In is licensed annually on a subscription basis with 1, 5, and 10 seat options, requiring renewal for continued use and covering each concurrent computer, with the ability to transfer individual seat activation's as needed. See our Pine BI Excel Add-In licensing page for full details.
For more information, explore the Pine BI Excel Add-In product range.
Tel: (888) 850 9911
Fax: +1 770 250 6199


