


Fornecedor oficial
Como distribuidores oficiais e autorizados, nós fornecemos licenças legítimas diretamente de mais de 200 editores de software.
Ver todas as nossas marcas.
Devart's ODBC Drivers bridge the gap between various databases and ODBC-compliant applications like reporting tools and analytics software. They provide secure, high-performance connections for accessing data from popular databases like SQL Server and Oracle on Windows, macOS, and Linux. Devart's drivers boast extensive functionality, allowing you to leverage features like stored procedures and data encryption for a seamless data transfer experience.
The latest updates to the Devart ODBC Drivers for Firebird, InterBase, MySQL, and Oracle add a new read-only mode to enhance data security by restricting users from accidentally or intentionally modifying database content. This is particularly beneficial for scenarios involving shared access to databases, ensuring data integrity for reporting, analytics, and other non-administrative tasks.
To see a full list of what's new in this latest release, see our release notes.
Devart ODBC Drivers are licensed per developer and are available as an Annual or Perpetual License with a 12 month support and maintenance subscription. See our Devart ODBC Driver Universal Bundle licensing page.
The new read-only mode is available in Devart ODBC Drivers for Firebird, InterBase, MySQL, and Oracle.
Devart ODBC Driver Universal Bundle includes all Devart ODBC Drivers in one package.
ComponentSpace is a software company specializing in developer tools for the Microsoft platform, particularly focused on secure single sign-on (SSO) solutions. Founded in 1995, they boast one of the world's leading deployments of SAML libraries, enabling developers to easily integrate secure login experiences leveraging SAML and OpenID Connect into their ASP.NET and ASP.NET Core applications.
ComponentSpace's recent product releases have added support for .NET 8 with example projects specifically targeting the latest version of Microsoft's .NET 8 framework. ComponentSpace components can now seamlessly integrate with applications developed using the latest version of the .NET framework, ensuring that developers can leverage the newest features and improvements provided by .NET 8 without worrying about compatibility issues.
.NET 8 support and example projects have been added to the following ComponentSpace products:
ComponentSpace products are licensed per developer. Licenses are perpetual and royalty-free and are available for single developers, four developers, and sites. Source Code is available as an option for Site Licenses. Priority Support is also available which provides enhanced technical support and software updates for 1 year. For more information see:
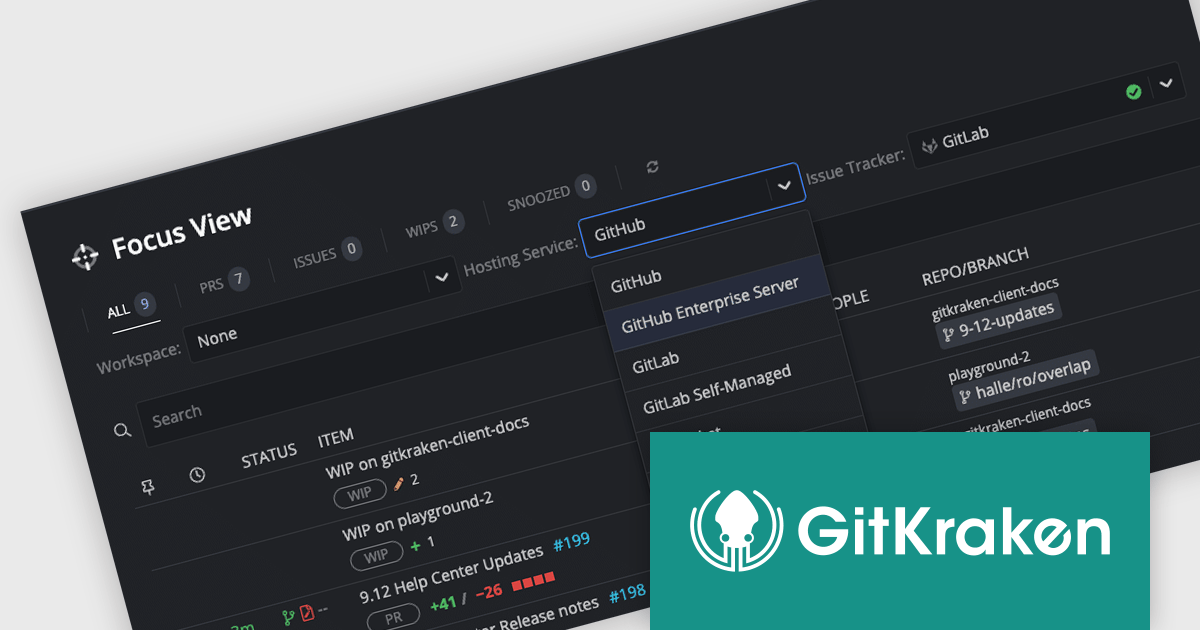
GitKraken is a suite of developer tools built around Git, a popular version control system. It offers a graphical user interface (GUI) that allows developers to interact with Git repositories visually instead of relying on command lines. This simplifies complex Git workflows like resolving merge conflicts and visualizing code history, making Git more accessible and efficient for developers of all experience levels.
The GitKraken 9.13.0 update enhances Focus View to streamline managing your workload. The improved view provides an actionable list of pull requests, Issues, and works in progress, along with hosting service connection status and configuration options. This update simplifies prioritizing tasks and ensures the correct hosting service is selected for your Cloud Workspace.
To see a full list of what's new in version 9.13.0, see our release notes.
GitKraken is licensed per user as an Annual license with free updates and technical support. See our GitKraken licensing page for full details.
For more information, visit our GitKraken product page.
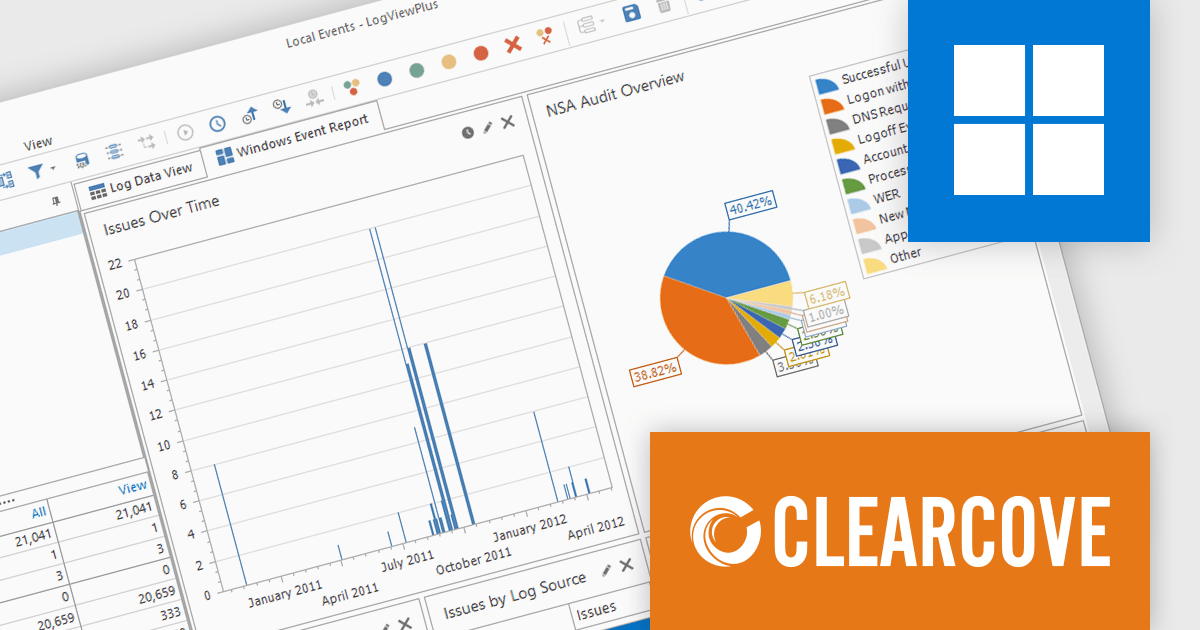
LogViewPlus streamlines application log analysis by intelligently parsing log structures for advanced filtering capabilities. It automatically detects common formats like JSON, XML, and CSV, and even allows you to create custom parsers for unique log types. This structure, along with the powerful filtering options, save you valuable time by simplifying debugging and system analysis.
Version 3.1.6 adds a built-in dashboard for Windows Events and EVTX files. This takes the complexity out of analyzing Windows Event Logs and EVTX files. It offers pre-built reports that provide immediate insights into critical areas, without any need for manual configuration. These reports automatically analyze issues over time, user logins, system updates, and more from your Windows Event Logs and EVTX files.
To see a full list of what's new in version 3.1.6, see our release notes.
LogViewPlus is licensed per user and is available as a or Perpertual license with 1 year support and maintenance. See our LogViewPlus licensing page for full details.
For more information, visit our LogViewPlus product page.
Infragistics Ultimate offers a comprehensive library of enterprise-grade, high-performance grids, charts, and other UI controls, plus visual configuration tooling, rapid prototyping, and usability testing. It comes with controls for Angular, React, jQuery, Web Components, Blazor, ASP.NET MVC, ASP.NET Core, ASP.NET Web Forms, Windows Forms, WPF and Xamarin.
Infragistics Ultimate 23.2 includes the updated Ignite UI for Blazor Data Grid and Blazor Table which are specifically crafted to effectively manage substantial datasets while maintaining essential interactive capabilities. They offer features such as virtualization for enhanced performance, row grouping and pinning, built-in columns with functionalities like filtering, moving, resizing, and sorting, as well as responsive layout support and collapsible group headers. These components are designed to cater to the practical needs of developers working with Blazor, providing them with reliable tools for efficiently handling large volumes of data within their applications.
Infragistics Ultimate is licensed per developer and is available as a Perpetual License with a 1, 2 or 3 year support and maintenance subscription. See our Infragistics Ultimate licensing page for full details.
The Ignite UI for Blazor Data Grid is available in the following products:
Tel: (888) 850 9911
Fax: +1 770 250 6199


