


Fornecedor oficial
Como distribuidores oficiais e autorizados, nós fornecemos licenças legítimas diretamente de mais de 200 editores de software.
Ver todas as nossas marcas.
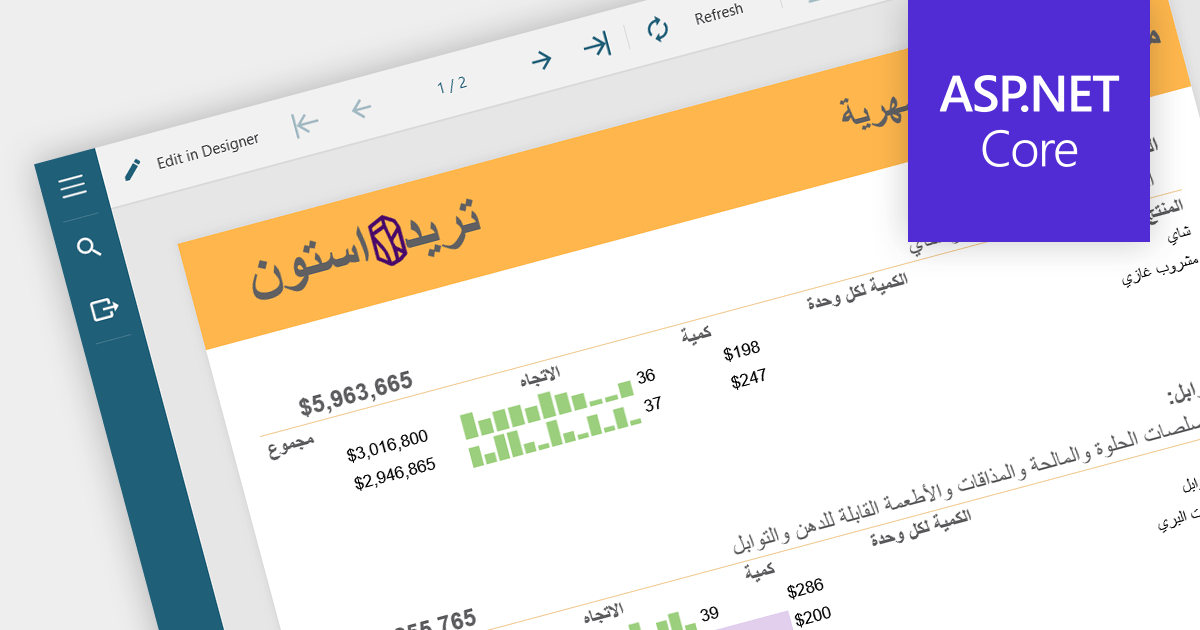
RTL (Right-to-Left) support refers to the ability to accommodate languages that are read from right to left, such as Arabic, Hebrew, Persian, Urdu, Kashmiri, Pashto, Uighur, Sorani Kurdish, and Sindhi. This feature ensures that reports can be created, displayed and printed correctly in RTL languages, which is essential for global applications and for users of RTL languages. It involves mirroring the layout and ensuring proper alignment and ordering of text.
Several ASP.NET Core Reporting components provide RTL (Right-to-Left) support including:
For an in-depth analysis of features and price, visit our ASP.NET Core Reporting Component comparison.
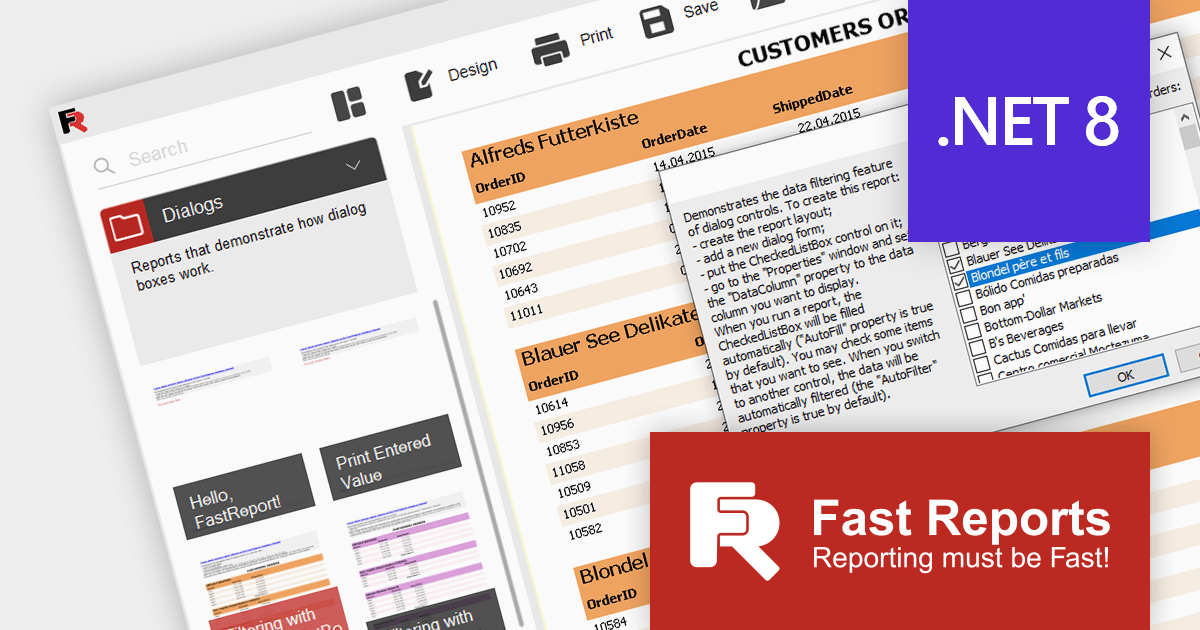
FastReport.NET is a reporting and document creation library specifically designed for the .NET framework. It provides developers with a powerful tool for creating application-independent reports within .NET applications. This library can be utilized as a standalone reporting tool or seamlessly integrated into existing applications. FastReport.NET includes a robust visual report designer that simplifies the process of creating and modifying reports.
FastReport .NET 2024.1 adds support for .NET 8, allowing developers to build reporting applications in the new release of Microsoft's popular .NET ecosystem. .NET 8 support has been added for FastReport.NET, FastReport.Core, FastReport.Core.Skia, and FastReport.WPF. The .NET 8 platform improves application performance and adds many new features that can now be utilized in your reporting projects.
To see a full list of what's new in the 2024.1 release, see our release notes.
For more information, visit our FastReport .NET product page.

EPPlus is a powerful and versatile .NET library for managing and manipulating Microsoft Excel files using the Office Open XML (OOXML) format. It is a lightweight and efficient library that is easy to use and can be integrated into a wide range of applications. It allows developers to create, read and modify spreadsheets without dependencies on any other library. Features include pivot tables, styling, VBA/Form controls, conditional formatting, charts, tables, formula calculation, data validation, pictures/shapes, and more.
The v7.0.3 release adds support for .NET 8. This enables developers to easily create and manage spreadsheets while working with the latest iteration of Microsoft's .NET ecosystem.
To see a full list of what's new in v7.0.3, see our release notes.
For more information, see our EPPlus product page.

PHP Tools for Visual Studio is an extension designed to enhance Visual Studio with PHP editing features such as code folding and syntax highlighting. Its formatter automatically formats your code when you type, making it easier to follow. PHP Tools for Visual Studio can also normalize spaces, aligning with Visual Studio conventions, and handles mixed HTML and PHP content.
PHP Tools v1.76 gains support for PHP 8.3 syntax, allowing you to target the latest version of the PHP language whilst maintaining correctly formatted code. PHP 8.3 syntax features include typed class constants, anonymous readonly classes, and dynamic class constant fetch.
To see a full list of what's new in v1.76.18866, see our release notes.
For more information, see our PHP Tools for Visual Studio product page.
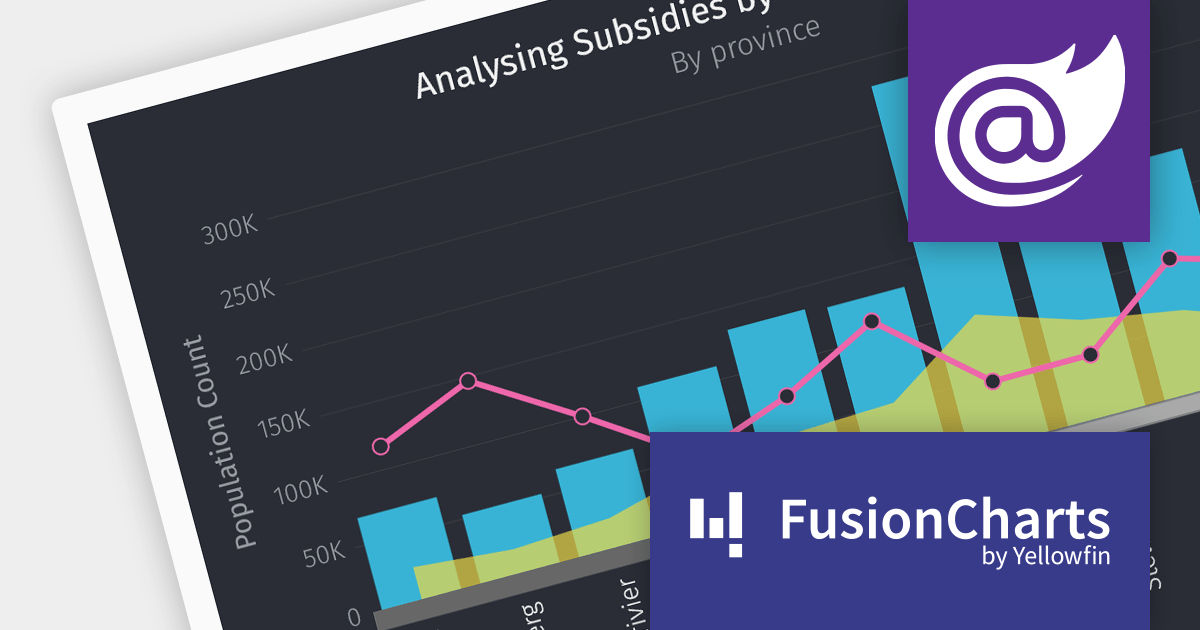
FusionCharts Suite XT is a powerful collection of charting and mapping tools that helps developers create interactive and data-driven dashboards for their web and mobile applications. It provides a wide range of features, including over 100 chart types, data-driven maps, and a variety of customization options. FusionCharts Suite XT helps you visualize and present data in a clear and engaging way.
The FusionCharts Suite XT v3.22 release introduces seamless integration with Blazor, allowing you to create visually appealing and informative data visualizations that enhance the overall user experience. These visualizations offer feature-rich configuration options that boost charting performance, enabling efficient client-side rendering and fast chart display, even with large datasets.
To see a full list of what's new in v3.22, see our release notes.
For more information, visit our FusionCharts Suite product page.
Tel: (888) 850 9911
Fax: +1 770 250 6199


