


Fornecedor oficial
Como distribuidores oficiais e autorizados, nós fornecemos licenças legítimas diretamente de mais de 200 editores de software.
Ver todas as nossas marcas.
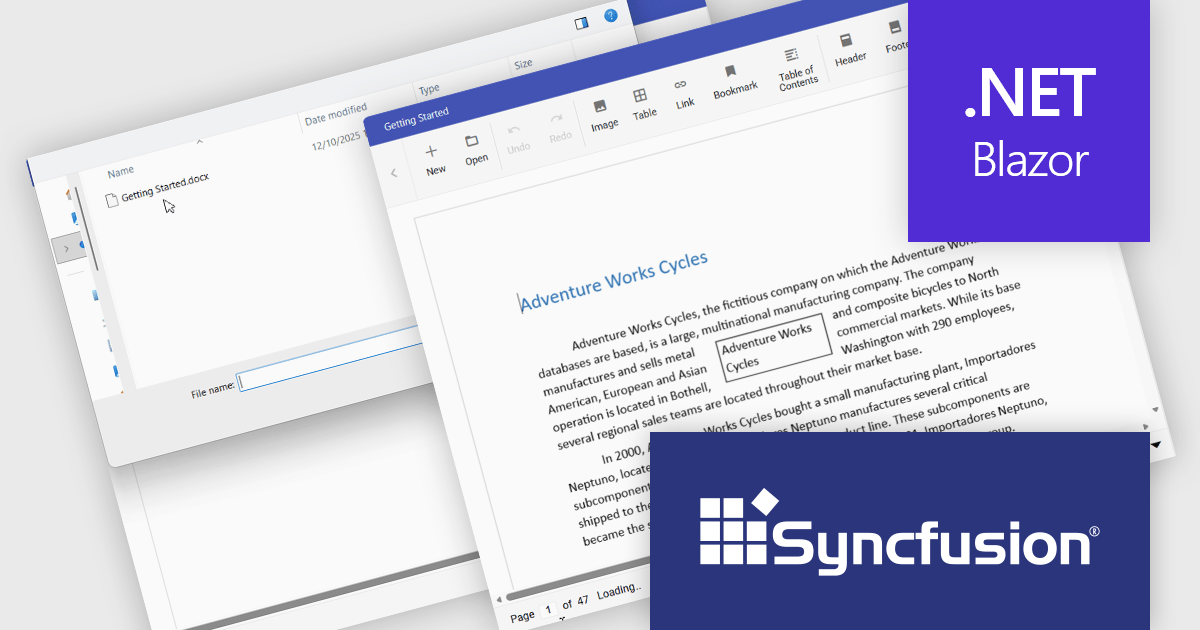
The Syncfusion DOCX Editor SDK provides a Microsoft Word inspired WYSIWYG editor that lets developers add Word document drafting, editing, and report generation to web and .NET desktop applications. It supports rich formatting with styles, tables, images, lists, and track changes, helping users create consistent, professional documents. With import and export support and a familiar interface, it reduces development effort and improves productivity for use cases like reporting, proposals, contracts, and document processes in business applications.
The Syncfusion Essential Studio DOCX Editor SDK 2025 Volume 4 update introduces asynchronous document loading for the Blazor DOCX Editor. This improves application responsiveness by preventing the user interface from blocking while documents are fetched and opened. By allowing document loading to occur in the background, developers can ensure the main thread remains available for user interactions, resulting in smoother navigation and more predictable behavior during network or file access delays. This enhancement helps create more responsive, user friendly applications, particularly when working with large documents or remote data sources.
To see a full list of what's new in Syncfusion Essential Studio DOCX Editor SDK 2025 Volume 4 (32.1.19), see our release notes.
Syncfusion Essential Studio DOCX Editor SDK is licensed per developer as a timed one year subscription that must be renewed to continue using the software. It is runtime royalty free for redistribution with a current subscription and includes one year of unlimited updates and 24/5 support with one business day responses. See our Syncfusion Essential Studio DOCX Editor SDK licensing page for full details.
Learn more on our Syncfusion Essential Studio DOCX Editor SDK product page.
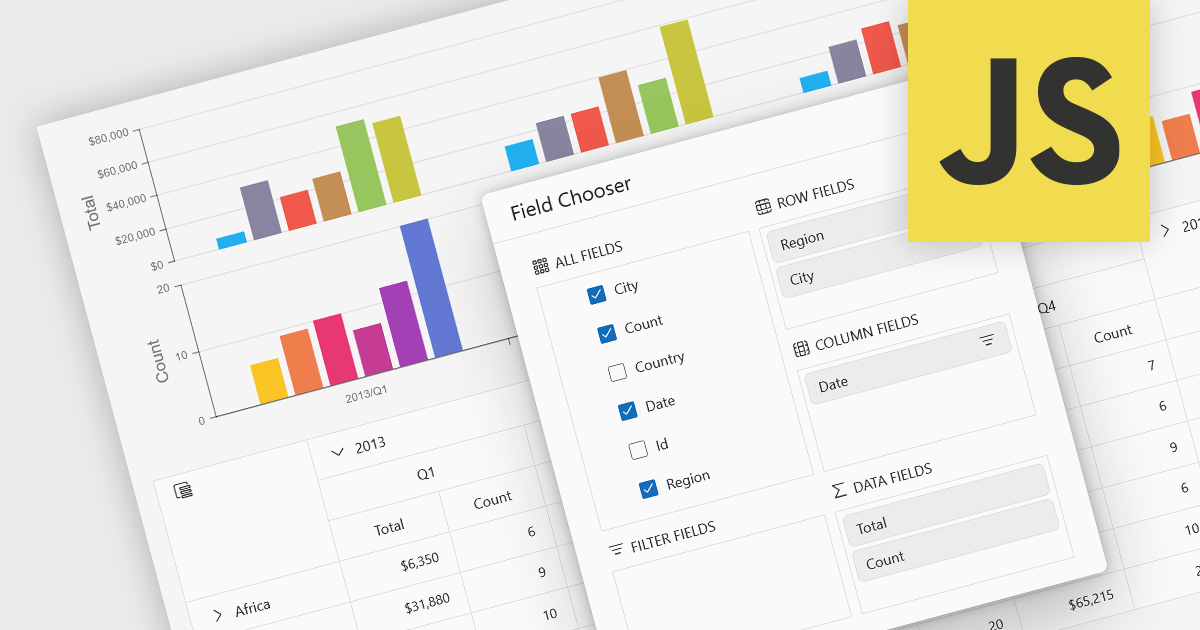
A pivot chart is a dynamic data visualization tool that works in conjunction with a pivot table to present summarized data in a graphical format. It allows users to interactively explore and analyze large datasets by adjusting dimensions such as categories, series, and filters without modifying the underlying data. By visually representing trends, comparisons, and patterns, pivot charts help users make data-driven decisions more efficiently. They are especially useful in business intelligence and reporting scenarios where clarity and flexibility in viewing aggregated data are essential.
Several JavaScript UI suites provide you with pivot chart functionality, including:
For an in-depth analysis of features and price, visit our comparison of UI suites.
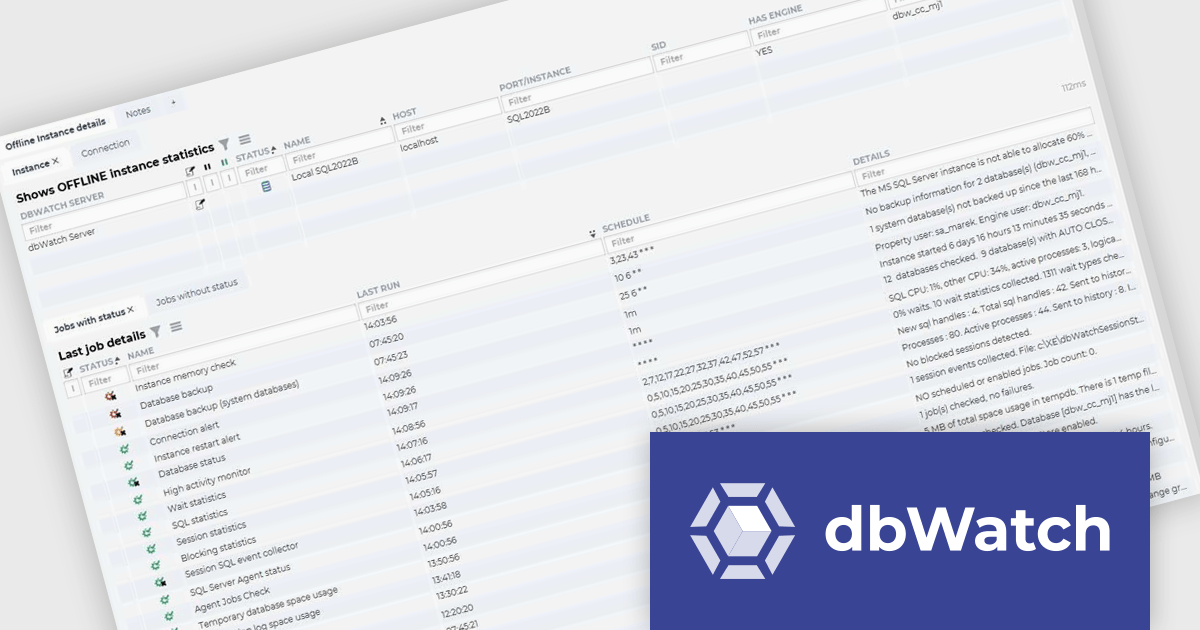
dbWatch is a comprehensive database monitoring and management solution designed to optimize the performance, reliability, and scalability of database environments. It provides features such as real-time monitoring, automated maintenance, detailed reporting, and robust authentication management. These capabilities help database administrators save time, ensure consistency, and enhance security across multiple database instances. dbWatch is ideal for organizations managing complex database infrastructures, supporting use cases such as proactive performance tuning, compliance monitoring, and database maintenance. With its user-friendly interface and automation tools, dbWatch empowers teams to efficiently manage their databases, reduce operational overhead, and focus on strategic initiatives.
The latest dbWatch Control Center update improves operational reliability by preserving the last known state of a monitored instance when connectivity is lost, so teams can continue investigating without live access to the database host. For software developers supporting production systems, this provides concrete diagnostic context such as the last recorded list of jobs, their most recent statuses, when they last ran, when data was last successfully collected, and relevant connection errors. With this information available during an outage, developers can determine scope of impact faster, distinguish monitoring gaps from application or infrastructure failures, and prepare a targeted remediation plan for quicker recovery once the instance is reachable again.
To see a full list of what's new in the latest update, see our release notes.
dbWatch Control Center is licensed per instance and is offered as a 12 month subscription license. Licenses are available for MS SQL Server, Oracle, MySQL, PostgreSQL, MariaDB, and Sybase. For further information see our dbWatch Control Center licensing page.
For more information, visit our dbWatch Control Center product page.
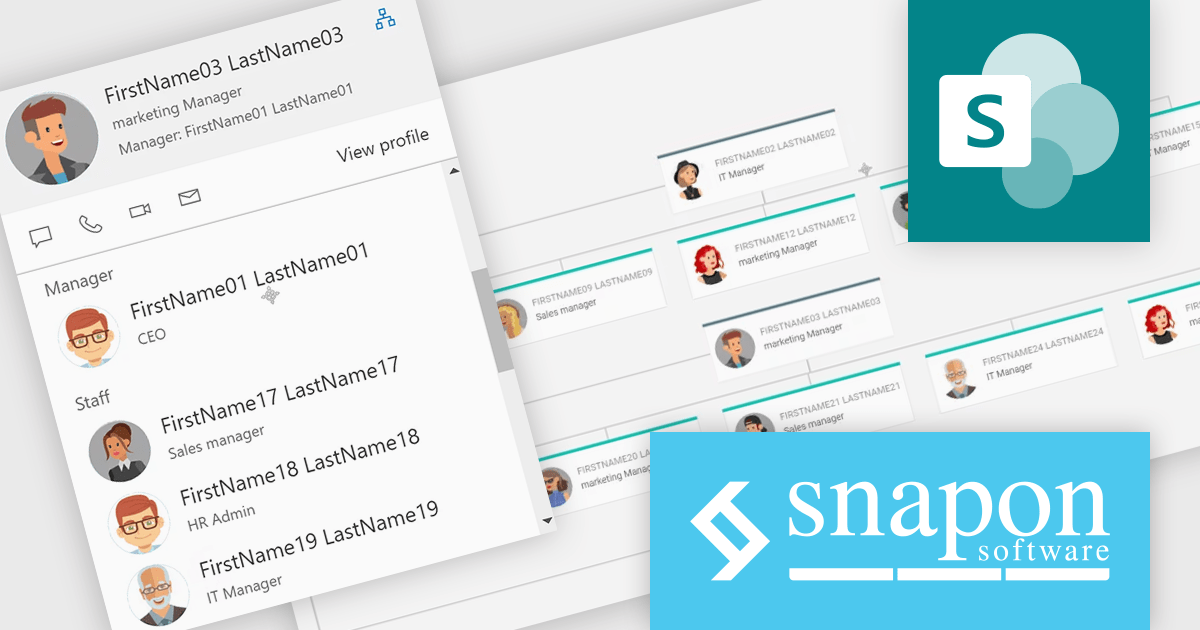
KWIZ Data View Plus products are a flexible solution for retrieving and displaying multiple data source types in modern, responsive, and fully customizable user interfaces, including KWIZ Calendar Plus, KWIZ Org. Chart, KWIZ List View Plus, KWIZ List Aggregator, and KWIZ Picture Gallery. Built for developers and solution architects, the suite supports consistent data presentation across calendars, org structures, lists, and galleries with extensible configuration to match application requirements. It helps teams deliver faster, clearer data experiences for use cases such as employee directories, project and resource scheduling, consolidated list reporting, and visual content browsing in enterprise applications.
The KWIZ Dataview Plus 1.6 update improves org chart usability by allowing the chart root to be reset to any selected person, so the UI can immediately refocus on that person’s manager, colleagues, and subordinates. For developers implementing or extending the component, this reduces the need to build custom navigation patterns for deep hierarchies and supports faster exploration of reporting structures with fewer expansion actions. It also preserves existing selection behavior, so opening persona views or customized cards continues to work as expected when users interact with nodes, helping teams add richer detail panels without sacrificing navigation speed or consistency.
To see a full list of what's new in version 1.6, see our release notes.
KWIZ Dataview Plus is licensed on an annual basis, requiring each user in your organization to be covered by an Annual Subscription license. Different levels are available to cater for different numbers of users. See our KWIZ Dataview Plus licensing page for full details.
For more information, visit our KWIZ KWIZ Dataview Plus product page.
ComponentOne Studio Enterprise is a comprehensive suite of .NET UI controls developed by MESCIUS (formerly GrapeCity) designed for building rich, interactive desktop, web, and mobile applications. It provides developers with a broad range of tools and components-including data grids, charts, reports, input controls, and advanced data visualization features-for platforms such as WinForms, WPF, ASP.NET Core, Blazor, WinUI, and .NET MAUI. The suite emphasizes performance, flexibility, and ease of integration, helping teams create consistent, feature-rich user experiences across multiple application types while maintaining a unified development approach.
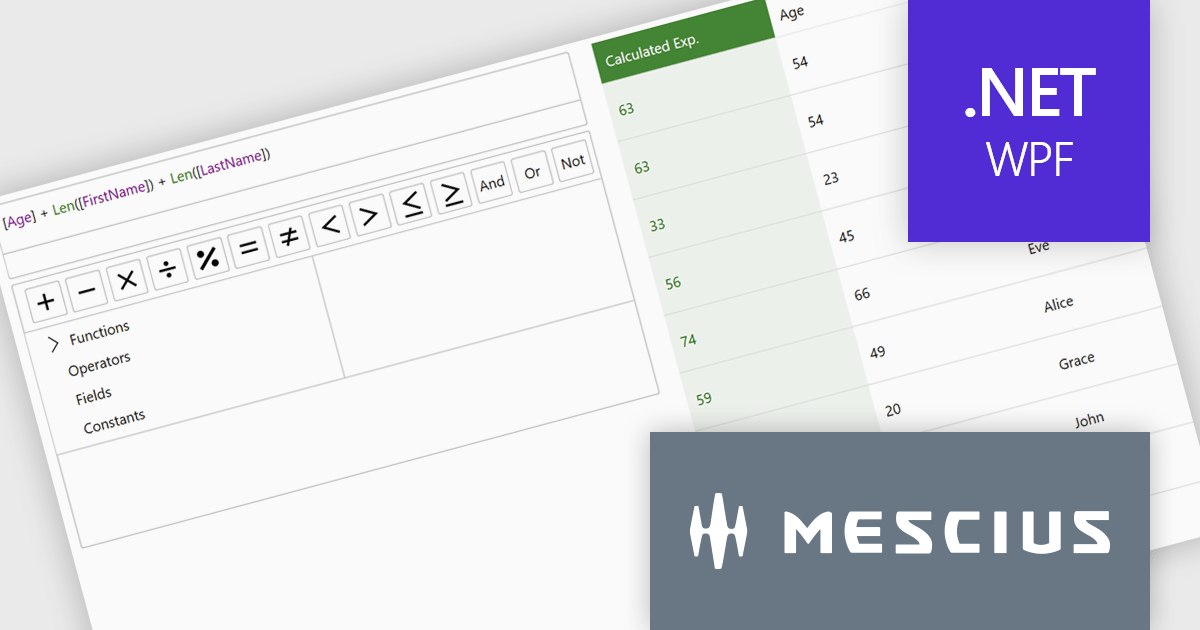
The ComponentOne Studio Enterprise 2025 v2 update introduces a modern WPF ExpressionEditor that enables developers to integrate a complete runtime formula-building experience directly into their applications. It allows end users to create, edit, and validate logical expressions using familiar Visual Studio–style code completion, syntax highlighting, and real-time error reporting, while also providing a set of built-in operators, constants, and aggregate, logical, mathematical, and conversion functions. By offering both a lightweight expression text box and a full-featured formula panel, the update reduces the need for custom expression editors, shortens development time, and improves the reliability and usability of data-driven application logic.
To see a full list of what's new in 2025 v2, see our release notes.
ComponentOne Studio Enterprise is licensed per developer on a perpetual basis and includes a 12 month subscription. Priority Support is also available. See our ComponentOne Studio Enterprise licensing page for full details.
Learn more on our ComponentOne Studio Enterprise product page.
Tel: (888) 850 9911
Fax: +1 770 250 6199


