Essential Studio for UWP 2016 Volume 1 adds Report Viewer

Adaptively render RDL and RDLC reports for phones, tablets or desktops.
Abril 22, 2016
Lançamentos em destaque

Syncfusion Essential Studio for UWP includes 35+ controls for Universal Windows app development. It features charts, diagrams, gauges, maps, treeviews, barcodes, rich text, and several file format manipulation libraries (Excel, Word and PDF). The toolkit includes everything you need to create touch-based apps and Enterprise dashboards. The controls are MVVM compatible and come with many real-world samples.

Updates in 2016 Volume 1

  • Chart Enhancements
    • Selection Cursor - Selectable series or segments can be identified by changing the cursor symbol.
    • Axis Header Alignment - Axis headers can be positioned outside of the plot area when an axis is placed inside the plot area with a custom origin.
    • Axis Label Rotation Enhancement - Axis label rotation will always correspond to tick lines for better readability.
    • Toolbar Customization - The size and margins of toolbar items can be customized.
    • Support for Null Values - Null points will be considered as empty points.
  • Data Grid Filtering Rows - Provides row filtering with different options to filter data in an efficient manner.
  • Multicolumn Drop-Down Control - Displays multiple columns in a drop-down box and supports an autocomplete function, and filtering while editing a large number of records.
  • Diagram Shapes - The diagram control provides predefined shapes such as basic, flow and arrow.
  • Group Bar Control - Provides an Outlook-style navigation UI to your application.
  • Collapsible UI - A collapsible UI is provided so selected content can be displayed in a pop-up window.
  • Heat Map - Represents tabular data values as gradient colors instead of numbers. Low and high values are different colors with different gradients.
  • Menu Control - Provides a hierarchical menu structure in different orientations.
  • Navigation Drawer - An interactive panel that emerges from the edge of the window and allows you to store content in a hidden panel. You can display the panel by swiping from the left, top, right and bottom edges of the window.
  • PDF Enhancements
    • Named Destinations - Named destinations can be added in PDF documents for interactive navigation. Destinations and properties can also be edited in existing PDF documents.
    • Flattening Annotations - Annotations such as circle, rectangle, polygon, and text markup can be flattened to disable the editing capability.
    • Built-in Table Styles - With just a few lines of code, table styles similar to Microsoft Word can be added to PDF grids and light tables.
    • GS1-128 Barcode - GS1-128 barcodes can be added in the PDF document, and the API supports exporting a barcode as an image.
  • Pivot Chart Control - Used to visualize business intelligence data buried in an OLAP Cube. This interactive control with drill-down capabilities allows you to surface big-picture data and makes it available with different chart types.
  • Pivot Gauge Control - Ideal for highlighting business-critical key performance indicators in executive dashboards and report cards. It presents values against goals in an intuitive manner.
  • Pivot Grid - An easily configurable, presentation-quality business control that reads OLAP data from a cube. It has drill-up and drill-down capabilities with key performance indicators and named sets.
  • Predictive Analytics - Supports predictive analytics for the following models: Association rules,  Clustering models, Cox regressions, General regressions, Gradient boosting models, Multinomial regressions, Naive Bayes, Neural networks, Random forests, Regression models, Vector machines and Tree models.
  • Presentation - Allows creating, reading, writing and modifying of Microsoft PowerPoint files. Presentation supports elements commonly found in a PowerPoint presentation, such as slides, paragraphs, text, images, bullets, numbering, charts, SmartArt, diagrams, shapes, tables, styles and formatting.
  • Progress Bar - Provides a customizable visual that indicates the progress of a given task.
  • New Pull to Refresh Control - An interactive content panel that allows users to pull down to refresh or load content in a view.
  • Report Viewer - Used to view RDL and RDLC reports within an application. It adaptively renders an optimal user interface for phones, tablets or desktops, helping the application to scale across all form-factors without additional effort.
  • Rotator Control - Allows interactive navigation through images to view or select them. It provides various navigation options like swiping, autoplay and tapping preview thumbnails or dots.
  • Spreadsheet Control - Excel-inspired component that allows you to create, edit, view and format Excel files without having Excel installed. It provides a seamless UI experience with an integrated ribbon.

About Syncfusion

Founded by industry experts in 2001, Syncfusion provides a broad range of enterprise-class software components and tools for the Microsoft .NET platform. Their award-winning .NET components and controls are designed to meet evolving development needs, whether working in Windows Forms, WPF, ASP.NET, ASP.NET MVC or Silverlight. Syncfusion strive for excellence in order to offer the very best value to customers - from small ISVs to Fortune 100 companies.
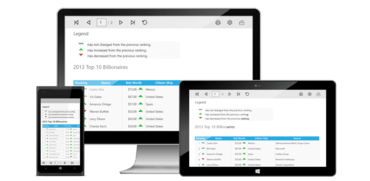
Report viewing app created using Syncfusion Essential Studio for UWP.

Syncfusion Essential Studio UWP

Crie facilmente aplicativos para a Plataforma Universal do Windows.

Tem alguma pergunta?

Chat ao vivo com nossos especialistas de licenciamento de Syncfusion.