ComponentOne Studio LightSwitch 2016 v2.5

Visualize dados hierárquicos com o novo gráfico sunburst.
Setembro 19, 2016
Nova versão

Recursos

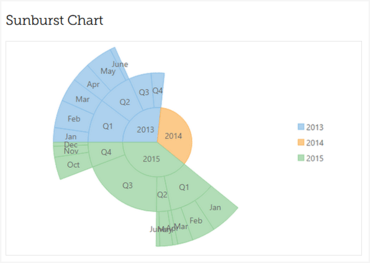
  • New Sunburst Chart - Sunburst or multi-level pie chart is used for visualization of hierarchical data. The circle in the center represents the root node with hierarchy moving outward from center. A segment of the inner circle is a parent to the segments of the outer circle which lie within the angular sweep of parent.
Sunburst charts let you visualize hierarchical data from a root node (center) outward to lower hierarchies.

ComponentOne Studio LightSwitch

Nenhum código, produtividade instantânea no Visual Studio LightSwitch.

Tem alguma pergunta?

Chat ao vivo com nossos especialistas de licenciamento de MESCIUS (formerly GrapeCity).