官方供应商
我们作为官方授权经销商,直接提供超过200家开发厂家所发行超过1000个的产品授权给您。
查看我们的所有品牌。
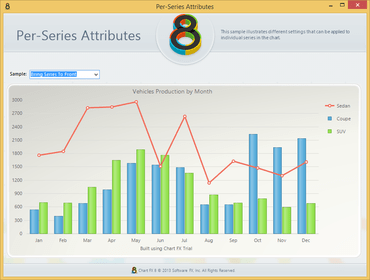
Chart FX 8 is a powerful charting engine that supports a large collection of chart types including bar, area, pie, line, curve, bubble, Parento, polar and surface. It lets developers and end users navigate through data. It features grouping, filtering, sorting and pivoting, all without writing a single line of code.
Software FX was founded in September of 1993 as a component vendor. By providing top-of-the-line components for different development environments, they continue to lead the market in deploying graphical development tools. Software FX is committed to providing a rich set of tools and support for past, present and future technologies for the global development community.

为.NET 开发人员提供的高级数据分析和可视化功能。
透过Live Chat与我们的Software FX 专家联络!