













官方供应商
我们作为官方授权经销商,直接提供超过200家开发厂家所发行超过1000个的产品授权给您。
查看我们的所有品牌。
Stimulsoft Ultimate is a reporting and dashboard solution that provides a set of tools for building interactive reports and data visualizations across platforms, including WinForms, ASP.NET, .NET Core, Blazor, JavaScript, WPF, PHP, Java, and Avalonia. It enables developers and organizations to design, generate, and deploy professional reports and dashboards using visual designers, flexible styling options, rich charting and data visualization components, and extensive data connectivity. With support for multiple development environments and technologies, Stimulsoft Ultimate helps teams improve report creation, maintain consistent designs, and deliver clear, data-driven insights for business intelligence, analytics, operational reporting, and enterprise applications.
The Stimulsoft Ultimate 2026.3.1 release adds a report viewer for Vue.js, giving developers a native way to integrate report viewing into modern Vue applications without relying on generic web components or framework workarounds. This provides a more consistent development experience, making it easier to embed interactive reports, maintain application architecture, and deliver responsive user interfaces. For organizations building new single-page applications or modernizing existing systems with Vue.js, the new viewer offers greater flexibility when incorporating reporting capabilities while helping to reduce integration effort.
To see a full list of what's new in 2026.3.1, see our release notes.
Stimulsoft Ultimate is licensed per developer with Single, Team, Enterprise, and WorldWide options that support one to unlimited developers within an organization. Licenses include a 12 month subscription with updates, priority technical support, a royalty free runtime report designer and viewer, and a build server license for Team and higher tiers. See our Stimulsoft Ultimate licensing page for full details.
Learn more on our Stimulsoft Ultimate product page.
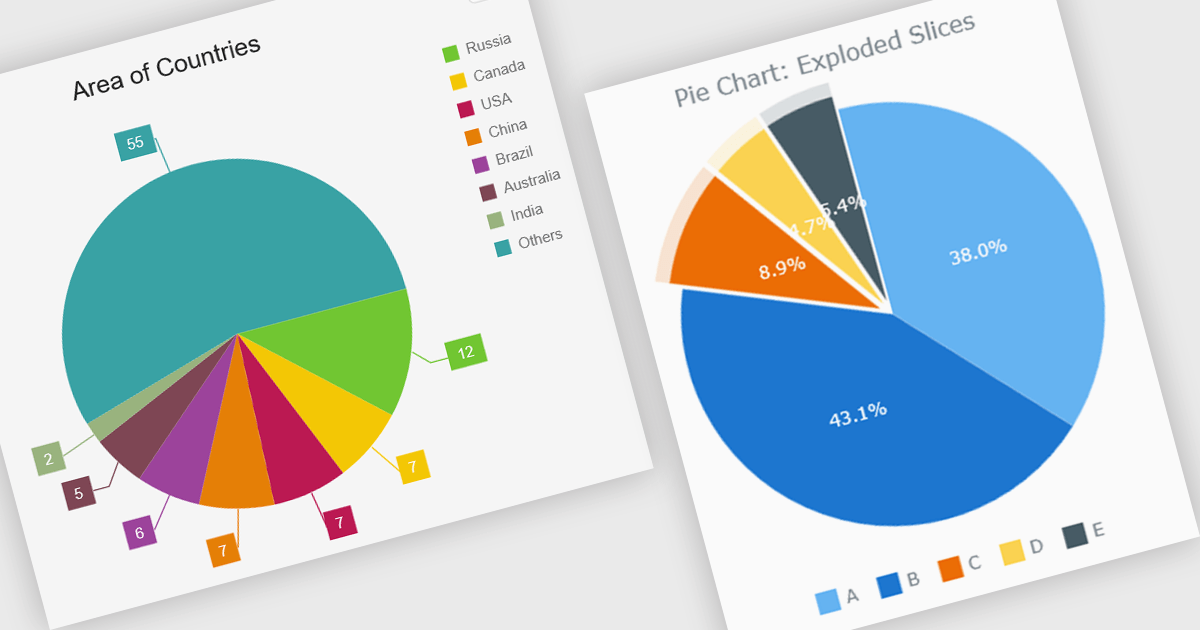
A pie chart enables developers to display data as proportional slices of a circle, with each slice representing a category's share of a single total. It is well suited to datasets that show part-to-whole relationships, making it easy for users to compare relative proportions at a glance. A well-designed implementation typically includes interactive features such as tooltips, legends, labels, animations, responsive layouts, and customization options, allowing the chart to integrate cleanly into modern web applications while providing a clear and accessible way to present composition data.
Several Vue.js chart components support pie charts, including:
For an in-depth analysis of features and price, visit our comparison of Vue.js charting components.
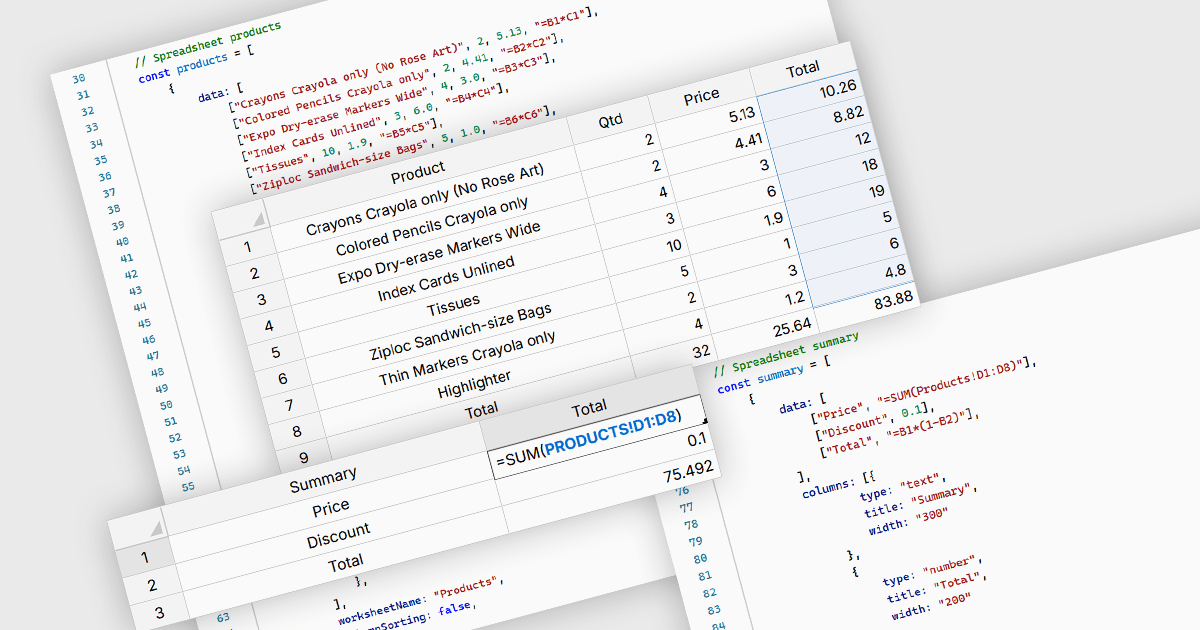
Cross-worksheet calculations allow formulas in one worksheet to reference cells, ranges, or named ranges located in another worksheet within the same spreadsheet. This capability enables related data to be organized across multiple worksheets while preserving links between them, reducing duplicated information, improving consistency, and making complex spreadsheet models easier to manage and maintain.
Several Vue.js spreadsheet components allow you to perform cross-worksheet calculations, including:
For an in-depth analysis of features and price, visit our comparison of Vue.js spreadsheet components.

jQWidgets is a comprehensive JavaScript UI framework offering a robust collection of over 60 widgets, themes, and utilities for building professional-grade, cross-platform web applications. Built on jQuery, HTML5, and CSS, it provides extensive functionality including data grids, charts, navigation, input validation, and more. jQWidgets simplifies web development, ensuring your applications work seamlessly across desktop browsers, tablets, and smartphones.
The jQWidgets v26.0.0 release includes a new jqxChat widget which adds conversational capabilities to web applications by providing a ready-to-use interface for real-time messaging and AI-assisted interactions. It supports rich message content, customizable appearance, and flexible integration with backend services and large language model (LLM) providers, making it suitable for customer support, virtual assistants, collaboration tools, and internal business applications. By incorporating jqxChat, developers can add engaging conversational experiences without building a chat interface from scratch, while maintaining the same look, feel, and development approach as the rest of the jQWidgets component library.
To see a full list of what's new in v26.0.0, see our release notes.
jQWidgets is licensed per developer and is available as a Perpetual license 1 year support and maintenance. See our jQWidgets licensing page for full details.
Learn more on our jQWidgets product page.
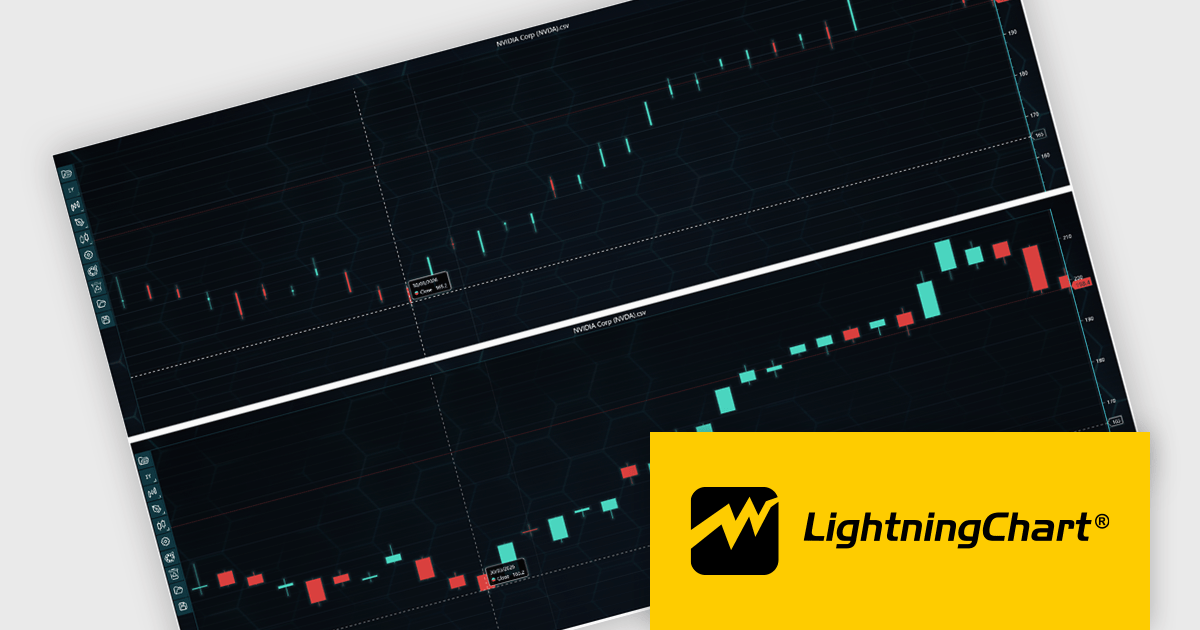
LightningChart JS Trader is a JavaScript/TypeScript library developed by LightningChart that specifically targets the creation of financial and trading applications. It provides high-performance, 2D, 3D, and real-time charting controls and a comprehensive suite of visualizations including candlestick, bar, line, and various technical indicators and drawing tools. This library enables software developers to create interactive technical analysis tools without the need for server-side setup as it runs completely on the client device.
LightningChart JS Trader automatically adjusts the width of candlesticks and bars as users zoom, improving chart readability and making more effective use of available space. By reducing unnecessary gaps between data points, it provides a clearer view of price movements and trends at different zoom levels without requiring manual configuration. This helps developers deliver more intuitive financial charting experiences while retaining the option to disable the feature when fixed-width rendering is preferred.
LightningChart JS Trader is licensed per developer and is available as an annual license with 1 year support. See our LightningChart JS Trader licensing page for full details.
For more information, see our LightningChart JS Trader product page.
联系电话: (888) 850 9911
传真: +1 770 250 6199


