查看所有组件类别
看到所有的组件类型
看到所有的组件环境
看到所有的组件发布
看到所有的应用程序类别
查看所有应用程序的类型
查看所有应用程序的开发厂家
查看所有添加的类别
请参阅所有外接程序的类型
看到所有外接程序的出版商
查看所有品牌
查看所有分类新闻
查看所有结构新闻
查看所有新闻
DevExpress
Aspose
Highsoft
MESCIUS (formerly GrapeCity)
Telerik
Syncfusion
Iron Software
Fast Reports
Steema Software
WPCubed
DBI Technologies
Infragistics
功能焦点
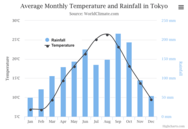
适用于各种平台 - 所有图表都可跨 PC、Mac、iPhone、iPad 和 Android 设备无缝运行。 所有图表都可在任何地方迅速提供相同的体验。.
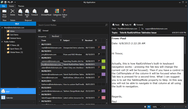
富文本编辑器 - 功能丰富的 WYSIWYG HTML和 Markdown 编辑器。 它包括编辑丰富内容并设置其格式的各种工具,并返回有效的 HTML 标记或 Markdown (MD) 内容。 它允许用户插入带有模块化架构的图像、链接、表格和列表。.
拖放功能实现轻松编辑 - 可在特定时间轻松移动和放置时间表对象。 可以配置默认的网格策略,使对象对齐至任何元素,包括千年、世纪、年代、年、月、周或日。.
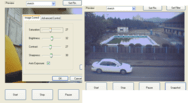
多媒体转换 SDK - 利用 DirectShow 和 Media Foundation 将音频和视频转换功能添加到 .NET (C# & VB) 和 C/C++ 应用程序中,以满足存档、互联网串流和移动兼容性等要求。.
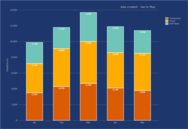
数据可视化小部件 - JavaScript 数据可视化小部件允许您将数据转换为其最简洁、最可读的可视表示形式。所有图表、量规和量程选择器小部件都能组成漂亮、内容丰富的仪表板,有效传达消息一目了然。.
Codejock Chart Pro - 图表类型包括条形图、散点图、线形图、饼状图、雷达图、极区图、面积图、财务图、甘特图、漏斗图、金字塔图、曲线图和分析图。 图表是完全可自定义的,使您几乎可以创建任意图表风格。.
Aspose.Words for .NET - 这是一个高级类别库,使您可以直接在应用程序中执行众多文件处理任务。支持 DOC、DOCX、OOXML、RTF、HTML、OpenDocument、PDF、XPS、EPUB 以及众多其他格式。.
Blazor DataFilter 组件 - DataFilter UI 提供筛选器以伴随任何广泛的数据收集。 它允许您连接到任何数据感知控件,包括数据网格、列表、树视图或图表。 您可以从数据源自动生成筛选器面板 UI,也可以手动创建它。 .
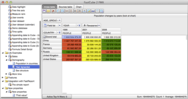
报表查看和导出 - 报表可显示在屏幕上,打印到打印机或导出为 PDF、丰富文本、Excel (XLSX)、Word (DOCX)、PowerPoint、HTML、JPEG、BMP、TIFF、CSV、Open Document Format(DDT、ODS、ODP)、可扩展矢量图形 (SVG)、DBF、PPML 等。.
报表设计器 - 包括一个强大的报表设计器,用于处理您应用程序中的报表,以及作为可用来创建和修改报表的独立应用程序使用。 此应用程序已为 Microsoft Windows 和 macOS 提供。.