官方供应商
我们作为官方授权经销商,直接提供超过200家开发厂家所发行超过1000个的产品授权给您。
查看我们的所有品牌。

截图: A bubble chart is just a variation of a point chart, only it displays bubbles of the data points. Data in displayed in a grid using Cartesian coordinates. Data is displayed along the x and y axis, where x and y can represent any type of data. ...

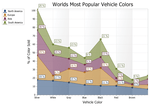
截图: A Stacked Area chart is very similar to an area chart. Data is displayed using different colors in the "area" below the line. Each series of points is represented with a different color. Area charts are commonly used to display accumulated ...

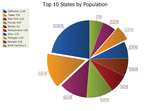
截图: A pie chart displays a series of data as "slices" of a "pie". The data in the pie chart will be divided up into slices, each represents a percentage of the pie. The size of the slice will be proportional to the data it represents and ...

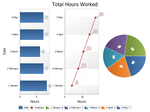
截图: Using the supplied "Chart Builder" tool you can build your charts using a WYSIWYG editor to customize the colors, etc. and export them to an xml file that can then be loaded into the chart control. ...

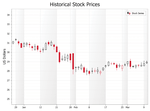
截图: A Candlestick Chart is used to display trends for financial data, generally stock market prices. Candlestick charts are much easier to rear than a traditional bar chart to a stock market trader. ...