Vizuly / SAPIEN Technologies / Active Database Software - 最畅销的

  1. 说明: Integrated Scripting Environment. PowerShell Studio is one of the most powerful and feature complete PowerShell Integrated Scripting Environment (ISE) available. Create graphical tools using PowerShell with the easy to use GUI designer. Eliminate the need ... 阅读更多

  2. $$ | 购买

    说明: 用这套开发工具提高生产效率。 SAPIEN DevOps Suite offers current versions of all SAPIEN Technologies desktop software tools; PrimalScript, PowerShell Studio, VersionRecall, PrimalSQL, PrimalXML, PowerShell HelpWriter, WMI Explorer, and PowerShell ModuleManager. The ... 阅读更多

  3. $$ | 购买

    说明: Powerful, state of the art scripting. PrimalScript is a powerful Universal Script Environment (USE), supporting over 50 languages. Its ribbon interface has been designed to provide virtually all functions you use every day on the Home tab. Create script ... 阅读更多

  4. $ | 购买

    说明: Get a handle on CIM classes and their properties and methods. CIM Explorer is a tool for exploring the Microsoft Windows Management Instrumentation database. The CIM database represents an extensive repository of information about your servers and client ... 阅读更多

  5. 5. Vizuly Corona 立即购买

    品牌: Vizuly
    主要类别: 图表控件
    $ | 购买

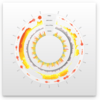
    说明: A radial line and area layout visualization. Vizuly Corona is a radial chart that provides angular and curved radial area line curves and supports both an overlap and stacked layout. It also features over a dozen different dynamic styles and comes bundled ... 阅读更多

  6. 6. Vizuly Halo 立即购买

    品牌: Vizuly
    主要类别: 图表控件
    $ | 购买

    说明: Represent transactional relationships from a specified number of sources to a variable number of targets. Vizuly Halo uses several different data visualization techniques to represent transactional relationships from a specified number of sources to a ... 阅读更多

  7. $ | 购买

    说明: Represent cartesian x/y data within a radial plot. Vizuly Radial Bar is designed to represent cartesian x/y data within a radial plot. It supports both clustered and stacked radial bars Use the interactive style explorer on the left to view different ... 阅读更多

  8. $ | 购买

    说明: Easily display multi-variate time series information. Vizuly Ring Chart lets you easily display multi-variate time series information. Due to its radial form factor, you can display 3 times the information for a given screen width than you could with a ... 阅读更多

  9. $ | 购买

    说明: Add stacked and clustered bar charts to your JavaScript apps. Vizuly Bar Chart supports both stacked and clustered layout options, as well as over 2 dozen different dynamic styles. It also comes bundled with a test container and examples of different ... 阅读更多

  10. $ | 购买

    说明: Add stacked and clustered column charts to your JavaScript apps. Vizuly Column Chart supports both stacked and clustered layout options, as well as over 2 dozen different dynamic styles. It also comes bundled with a test container and examples of ... 阅读更多