官方供应商
我们作为官方授权经销商,直接提供超过200家开发厂家所发行超过1000个的产品授权给您。
查看我们的所有品牌。
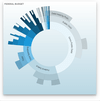
说明: Adds Sunburst charts to your JavaScript apps. Vizuly Sunburst is designed to represent hierarchical data in a radial plot. It supports drill down and drill up capabilities by allowing the user to collapse and expand segments of the sunburst when they ... 阅读更多
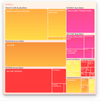
说明: Add Tree Map charts to your JavaScript apps. Vizuly Tree Map visualizes hierarchical data in nested rectangular plots where the area of each rectangle is bound to a data property you can set. This TreeMap also supports the ability to drill down/up, in ... 阅读更多
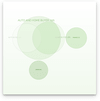
说明: Add Venn Diagram charts to your JavaScript apps. Vizuly Venn Diagram shows all possible logical relations between a finite collection of different sets. This chart depicts elements as points in the plane, and sets as regions inside closed curves. A Venn ... 阅读更多

说明: Add Word Clouds to your JavaScript apps. Vizuly Word Cloud is a unique way to represent the occurrence rate of words within a given text stream. This visualization supports an exclusion list that will ignore common pronouns, profanity, or any words you ... 阅读更多

说明: Add charts and visualizations to your JavaScript apps. Vizuly Professional includes Corona, Halo, Radial Bar, Ring Chart, Weighted Tree, Geo Plot, Bar Chart, Column Chart, Line Area Chart, Radar Chart, Radial Progress, Scatter Plot, Sunburst, Tree Map, ... 阅读更多
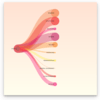
说明: Represent asymmetric hierarchical information in an easy to read visualization. Vizuly Weighted Tree nodes and branches can be dynamically sized and styled based on data bound properties that you set. One challenge with large hierarchal tree structures is ... 阅读更多
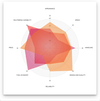
说明: Add Radar charts to your JavaScript apps. Vizuly Radar Chart graphs multiple dimensions of one datum along multiple radial axis. Each plot represents 3 or more data points along shared axis lines. This chart supports highlighting of both individual data ... 阅读更多

说明: High-end data visualization for the Python ecosystem. Highcharts for Python is a collection of Python libraries that gives you access to all the rich features of Highcharts Core (formerly Highcharts JS), Highcharts Stock, Highcharts Maps and Highcharts ... 阅读更多

说明: A comprehensive UI controls library for ASP.NET MVC. Syncfusion Essential Studio for ASP.NET MVC includes over 80 controls. It contains all you need for building line-of-business applications, including popular widgets such as a data grid, chart, gantt, ... 阅读更多

说明: A comprehensive UI controls package for WinForms. Syncfusion Essential Studio for Windows Forms includes 100+ essential controls like DataGrid, Charts, Diagram, PDF Viewer, file format libraries, and much more for building powerful line-of-business ... 阅读更多