


Offizieller Lieferant
Als offizieller und autorisierter Distributor beliefern wir Sie mit legitimen Lizenzen direkt von mehr als 200 Softwareherstellern.
Sehen Sie alle unsere Marken.
Auf Englisch weiterlesen:
DataGrip is a multi-engine database environment that supports MySQL, PostgreSQL, Microsoft SQL Server, Oracle, Sybase, DB2, SQLite, HyperSQL, Apache Derby and H2. It includes an editor that provides intelligent coding assistance such as auto-completion, analysis and navigation. It also features a query console for running and profiling queries.
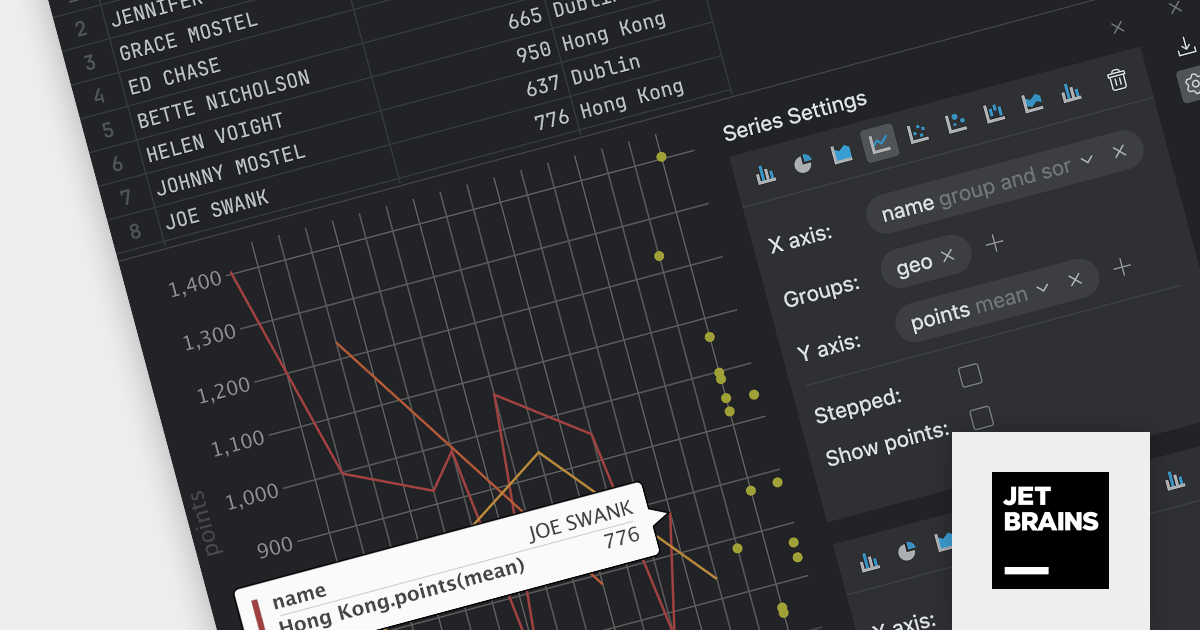
The DataGrip 2023.3 release seamlessly integrates charts within the data editor using the Lets-Plot library, allowing you to easily visualize query results and database object data. It offers a range of chart types including bar, pie, area, line, scatter, bubble, and stock charts. DataGrip intelligently selects the most suitable default chart type based on the data types involved, ensuring optimal data presentation and analysis.
Data can be grouped to uncover meaningful patterns and trends, and charts can be exported to PNG format. For database objects and DSV files, the chart is displayed alongside the table in split-view mode. In contrast, for in-editor results and query results shown in the Services tool window, the chart view replaces the table.
To see a full list of what's new in version 2023.3, see our release notes.
For more information, visit our DataGrip product page.


Tel.: (888) 850 9911
Fax: +1 770 250 6199


