


Offizieller Lieferant
Als offizieller und autorisierter Distributor beliefern wir Sie mit legitimen Lizenzen direkt von mehr als 200 Softwareherstellern.
Sehen Sie alle unsere Marken.
Auf Englisch weiterlesen:
DevExpress VCL Subscription is a comprehensive suite for Delphi and C++ Builder developers that includes high-performance UI components, reporting tools, data visualization elements, and application templates. It lets you build rich, data-driven business applications with ease, offering ongoing updates, technical support, and royalty-free distribution rights, perfect for boosting developer productivity and delivering polished software experiences.
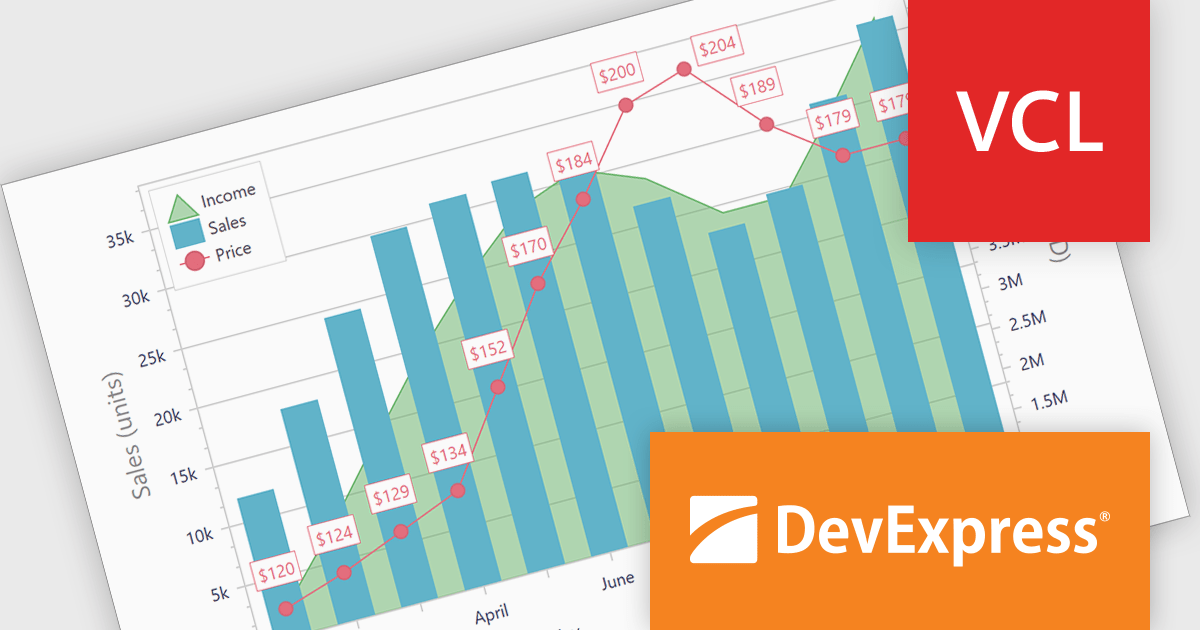
The DevExpress VCL Subscription 24.1 chart control adds support for secondary axes. This innovative feature allows you to overlay an additional Y axis on your chart. This means you can plot data measured in, for example, temperature (degrees Celsius) alongside values in percentage. Each axis has its own scale and labels, keeping your chart clear and avoiding the need to convert units or create separate charts. This is particularly useful for comparing data sets that would otherwise be difficult to display on a single scale.
To see a full list of what's new in version 24.1, see our release notes.
DevExpress VCL Subscription is licensed per developer and is available as a Perpetual License with a 12 month support and maintenance subscription. See our DevExpress VCL Subscription licensing page for full details.
For more information, visit our DevExpress VCL Subscription product page.


Tel.: (888) 850 9911
Fax: +1 770 250 6199


