


Offizieller Lieferant
Als offizieller und autorisierter Distributor beliefern wir Sie mit legitimen Lizenzen direkt von mehr als 200 Softwareherstellern.
Sehen Sie alle unsere Marken.
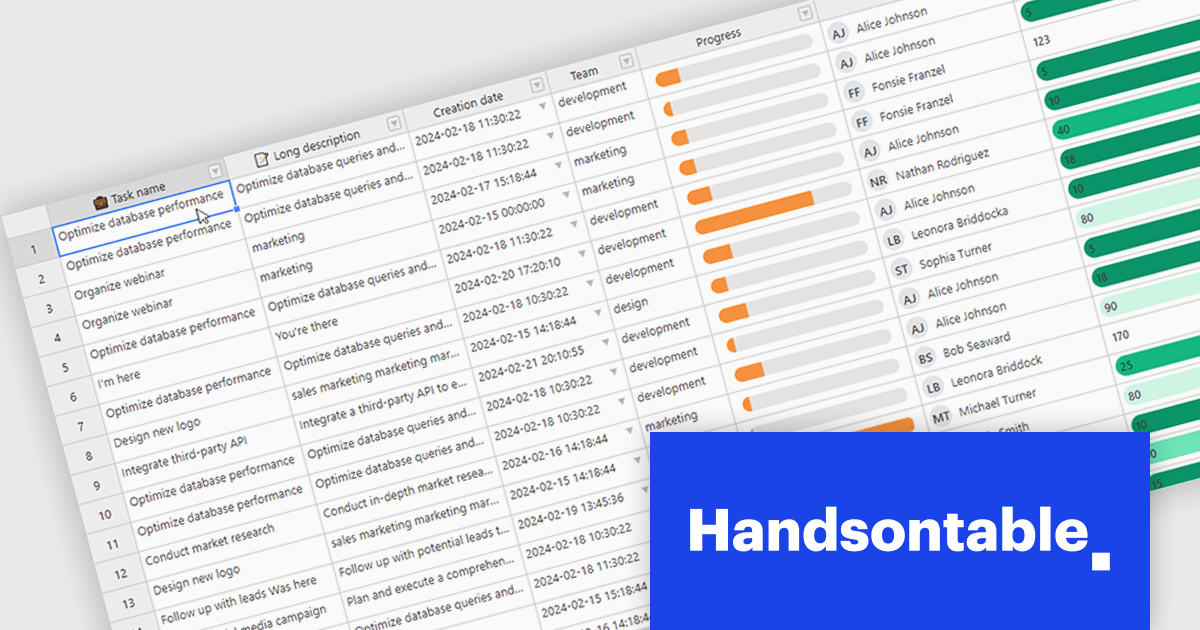
Handsontable is a JavaScript library designed to help developers build interactive data grids into their web applications. Offering a familiar spreadsheet-like interface, it allows users to edit, sort, and filter data with ease. Highly customizable and compatible with popular frameworks like React and Angular, Handsontable empowers developers to build robust data manipulation features into their web applications.
Handsontable 14.2.0 improves cell re-rendering using the React wrapper. The wrapper now uses memoization to optimize performance during user interactions like cell editing or scrolling in the grid, allowing the wrapper to remember the previous state and only update the elements that have actually changed. This smarter approach results in a smoother and more stable experience in your Handsontable apps, especially for complex custom cell types.
To see a full list of what's new in version 14.2.0, see our release notes.
Handsontable is licensed per developer and is available as an Annual or Perpetual license with 1 year support and maintenance. See our Handsontable licensing page for full details.
For more information, visit our Handsontable product page.
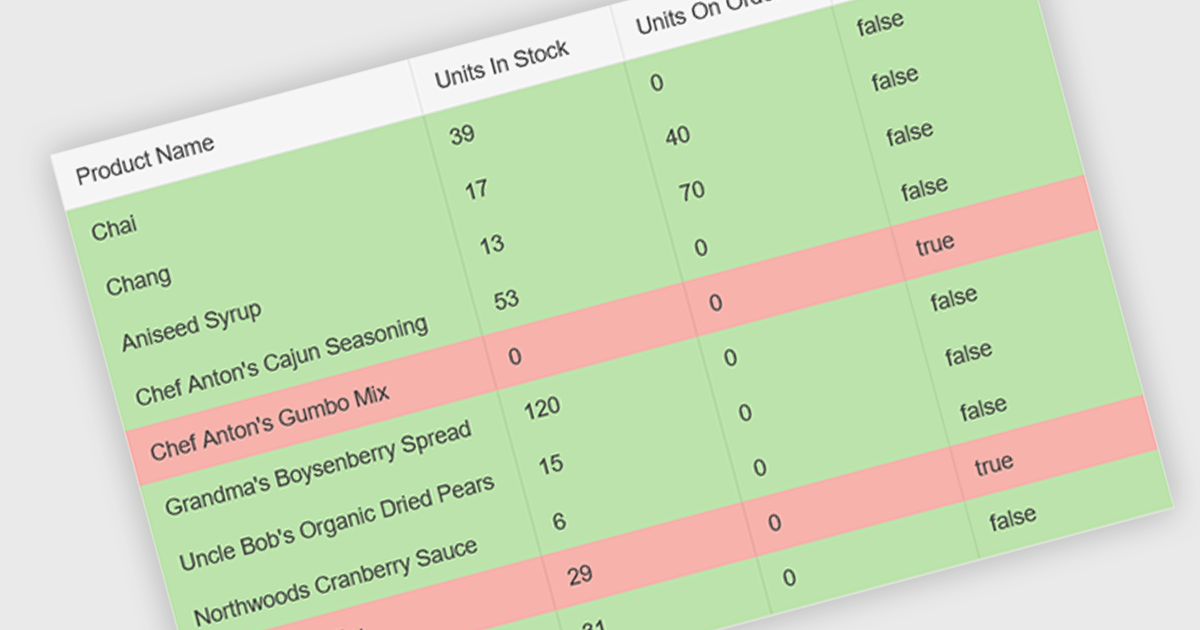
Conditional formatting in a grid allows you to dynamically alter the visual style of cells based on specific criteria within your data. This functionality enhances readability and user experience by highlighting important information. For instance, negative values can be displayed in red, exceeding values in bold, and empty cells with a light gray background, all within the grid itself. This reduces the need for users to manually scan through data and immediately draws attention to critical elements.
Several React grid controls offer conditional formatting, including:
For an in-depth analysis of features and price, visit our comparison of React Grid controls.
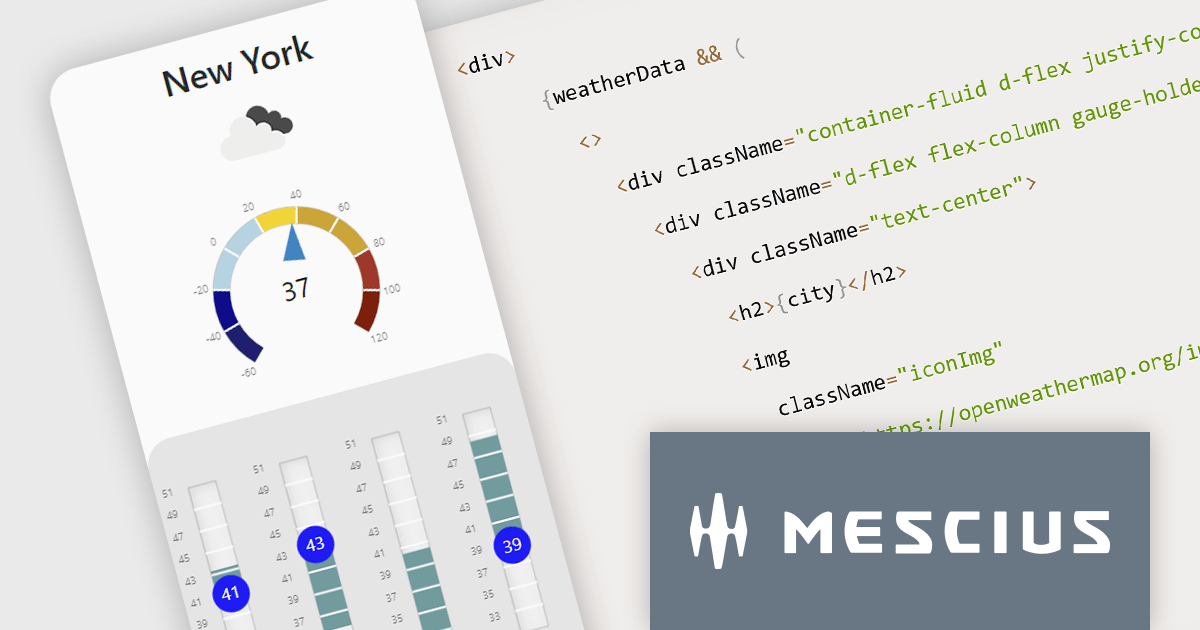
Wijmo is a complete collection of extensible, fast, flexible JavaScript UI components written in TypeScript. The framework-agnostic Wijmo components include first-class support for top frameworks including Angular, React, Vue and Web Components. Wijmo Enterprise has over 100 dynamic JavaScript UI components to help cut your development time in half, allowing you to build lightweight, high-performance JavaScript applications using your favorite JavaScript framework.
In this blog post, MESCIUS Technical Engagement Engineer Andrew Peterson shows you how to utilize the Wijmo Gauges - along with the OpenWeatherMap API - to build a React app to display the current weather. Steps include:
Read the complete blog to explore this powerful and rich capability.
Wijmo is licensed per developer. Developer Licenses are perpetual and include 1 year Subscription which provides upgrades, including bug fixes and new features. See our Wijmo licensing page for full details.
For more information, visit our Wijmo product page.
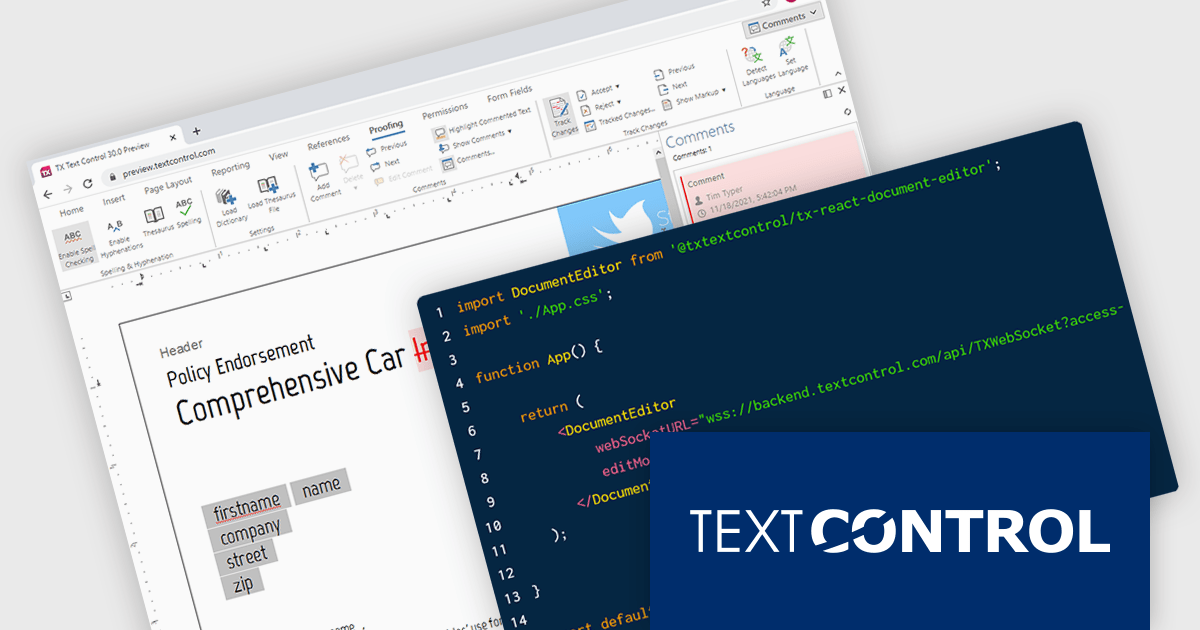
TX Text Control .NET Server for ASP.NET is a server-side component that equips your web applications with a powerful, MS Word-compatible document editor. This allows you to develop applications that generate and edit various document formats (RTF, DOCX, PDF, etc.) on the fly, using data from databases or files. It also boasts features like PDF generation and a browser-based editor with a familiar MS Word-inspired interface, ultimately enhancing the document processing capabilities of your ASP.NET web applications.
TX Text Control .NET Server now includes React npm packages. These client-side packages seamlessly integrate with TX Text Control .NET Server, which acts as the powerful backend engine for the Document Editor and Document Viewer components. Empower your users with an Microsoft Word-like document editor, accessible from any HTML5 browser.
TX Text Control .NET Server for ASP.NET is licensed per developer and is available as a Perpetual License with a 12 month support and maintenance subscription. Run time licenses are required for the deployment to production servers. See our TX Text Control .NET Server for ASP.NET licensing page for full details.
For more information, visit our TX Text Control .NET Server for ASP.NET product page.
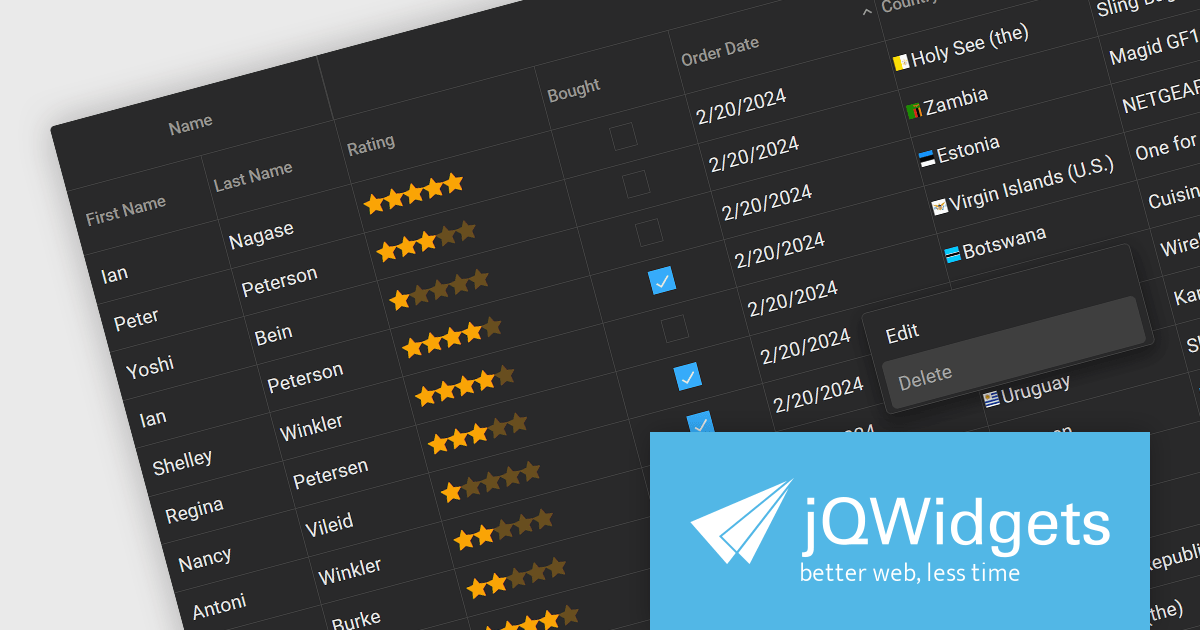
jQWidgets is a comprehensive JavaScript UI framework offering a robust collection of over 60 widgets, themes, and utilities for building professional-grade, cross-platform web applications. Built on jQuery, HTML5, and CSS, it provides extensive functionality including data grids, charts, navigation, input validation, and more. jQWidgets simplifies web development, ensuring your applications work seamlessly across desktop browsers, tablets, and smartphones.
The jQWidgets v19 release introduces a built-in context menu. This menu appears upon right-clicking within the grid, offering users context-specific options relevant to their current selection or interaction. This eliminates the need to navigate to separate menus or tools, streamlining user interactions and significantly improving usability. By providing immediate access to relevant actions within the grid itself, users can work more efficiently and productively. This new addition enhances the overall user experience for anyone working with jqxGrid.
To see a full list of what's new in v19.0.0, see our release notes.
jQWidgets is licensed per developer and is available as a Perpetual license 1 year support and maintenance. See our jQWidgets licensing page for full details.
Learn more on our jQWidgets product page.


Tel.: (888) 850 9911
Fax: +1 770 250 6199


