


Offizieller Lieferant
Als offizieller und autorisierter Distributor beliefern wir Sie mit legitimen Lizenzen direkt von mehr als 200 Softwareherstellern.
Sehen Sie alle unsere Marken.
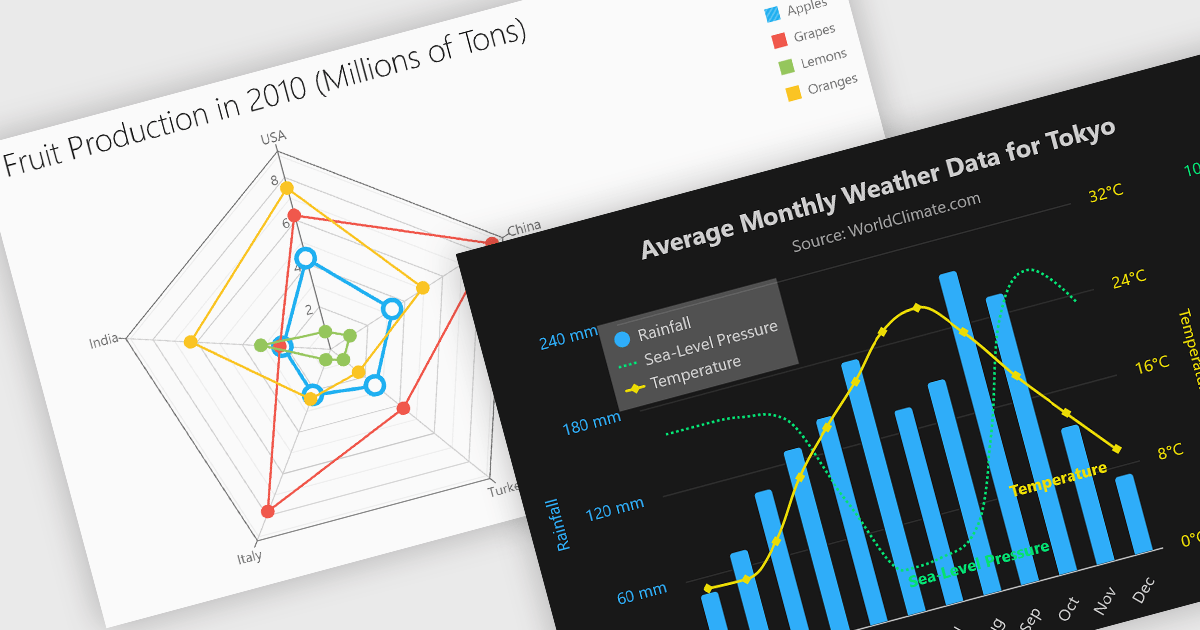
Multi-dimensional and relationship charts allow developers to present complex data structures and inter-variable relationships in a way that’s visually intuitive and analytically powerful. These chart types are essential for exploring correlations, comparing grouped metrics, and visualizing distributions across multiple dimensions. They are commonly used in statistical dashboards, performance analysis tools, and scientific applications where simple line or bar charts aren’t sufficient to capture the full context of the data.
Common charts include:
For an in-depth analysis of features and price, visit our Angular Chart components comparison.
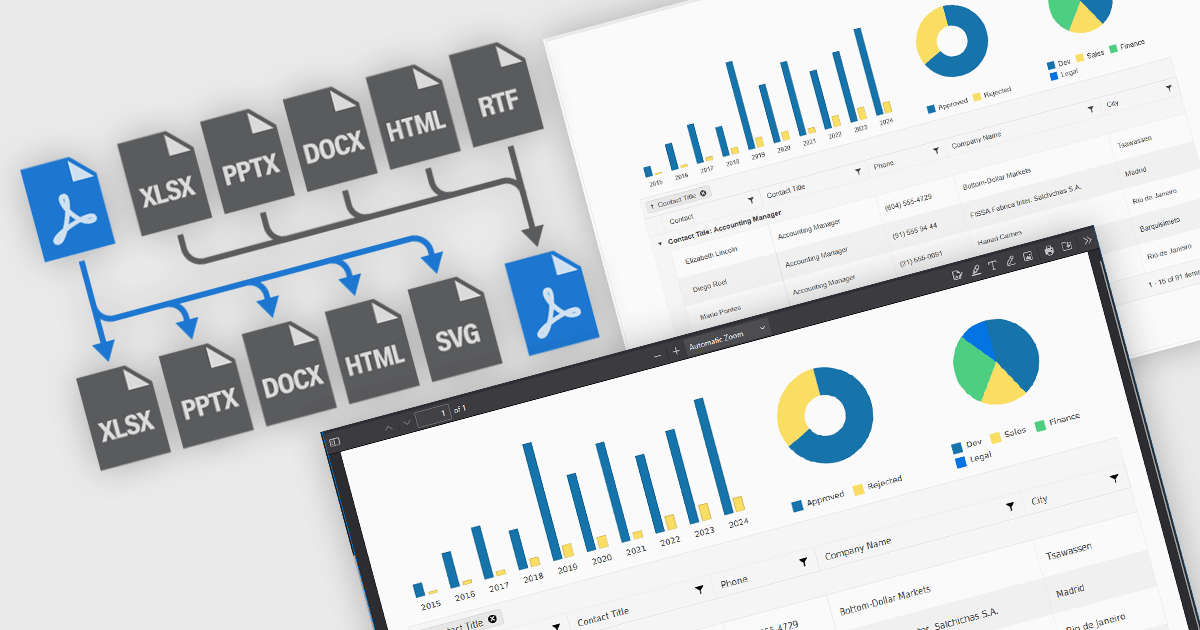
JavaScript PDF components that support format conversion play a critical role in modern web and enterprise applications, allowing developers to programmatically generate, manipulate, and transform documents within the browser or on the server. These tools simplify workflows that require format interoperability, such as generating printable reports from web content, archiving dynamic documents, or extracting data for analysis. Their ability to convert between PDF and other widely used formats ensures compatibility across systems, supports digital transformation goals, and enhances document handling efficiency.
Common conversions include:
For an in-depth analysis of features and price, visit our JavaScript PDF components comparison.
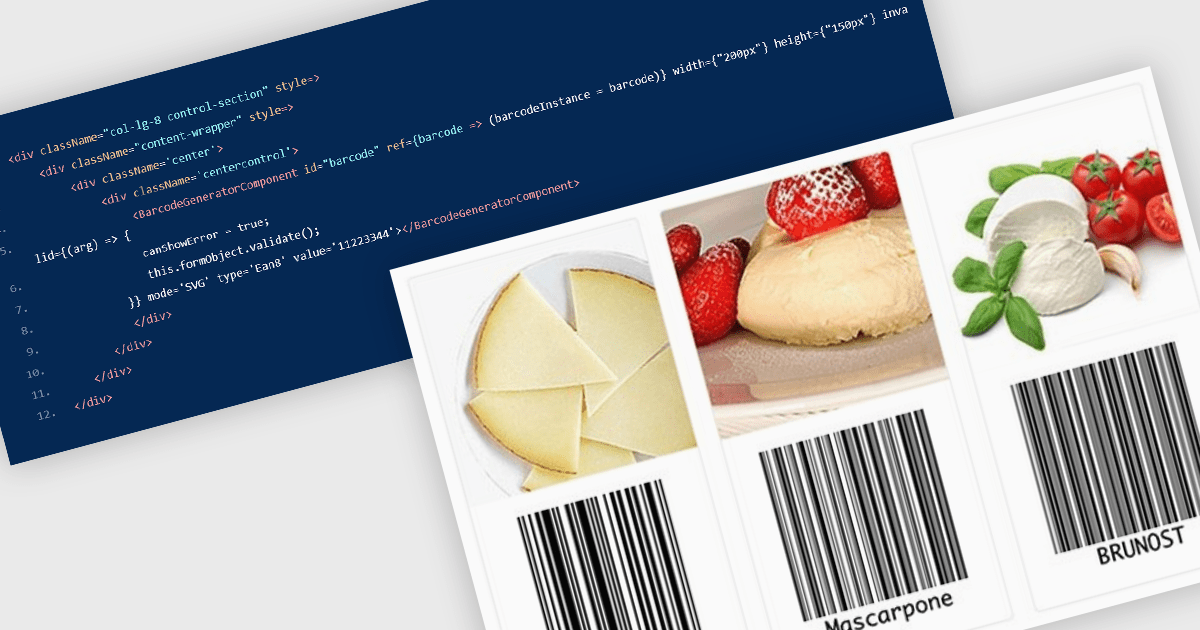
Barcode components in React UI suites deliver a easy way to integrate machine-readable encoding directly into modern web applications. These components offer a high-level interface for rendering both one-dimensional and two-dimensional barcodes, with customizable options for type (symbology), dimensions, styling, and export formats. They enable developers to choose between vector-based (SVG) or bitmap (Canvas) rendering, and often support direct exports to PNG, PDF, or SVG formats. Such features make barcodes a flexible integration point for inventory systems, shipping labels, ticketing, and other use cases requiring reliable, visual encoding of data within React environments.
Several React UI suites offer Barcode components including:
For an in-depth analysis of features and price, visit our React UI suites comparison.
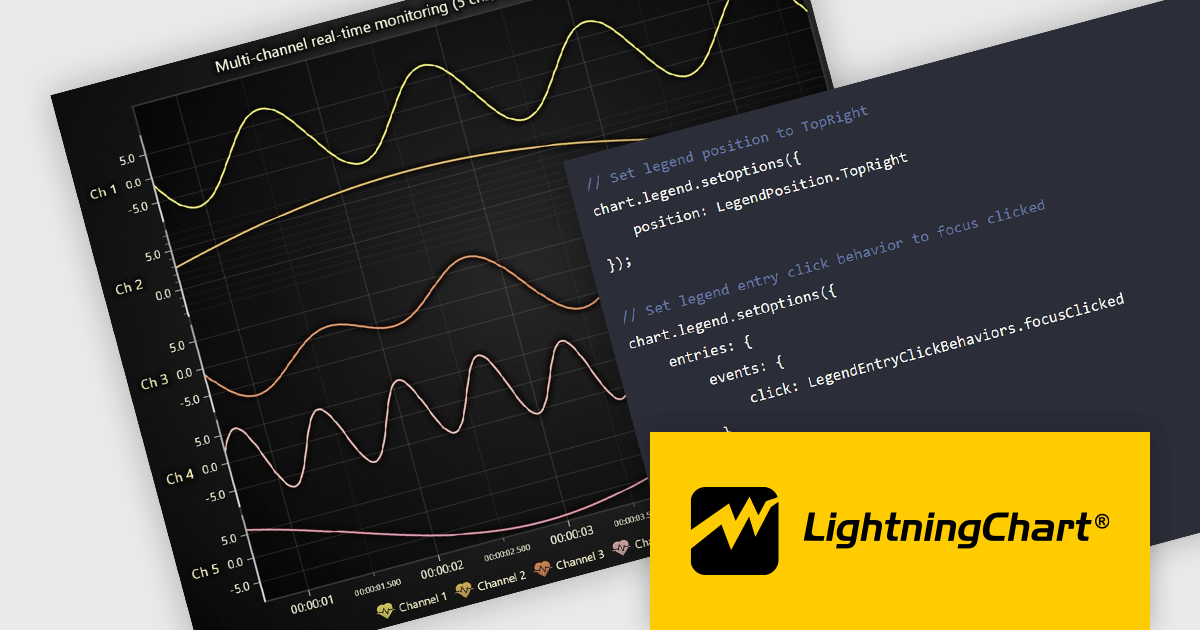
LightningChart JS is a high-performance JavaScript charting library that utilizes WebGL rendering and GPU acceleration to deliver exceptional performance for a wide range of data visualization needs. It is designed to handle large datasets and complex visualizations with ease, enabling developers to create interactive and visually appealing 2D and 3D charts. Ideal for applications demanding smooth real-time data updates, such as financial platforms, engineering tools, scientific research dashboards, and industrial monitoring systems, LightningChart JS provides a comprehensive API for customization and integration into web-based projects.
The LightningChart JS v8.0 update completely reworks legend functionality, making legends a property of the chart, removing visual obstructions, and improving adaptability to available space. The API configuration is now more intuitive and capable, with built-in options supporting a wider range of use cases. Plug‑in support also enables easy extension or customization of legend behavior. By default, legends now appear automatically beneath trends, reducing developer setup time, while still allowing you to manually create multiple legends when needed. You can position legends using built-in presets or define custom placements, and control click behavior using either the provided handlers or your own. When creating series, you can also exclude specific ones from appearing in legends, giving you fine-grained control over legend content.
To see a full list of what's new in v8.0, see our release notes.
LightningChart JS is licensed per developer and is available as an annual license with 1 year support. See our LightningChart JS licensing page for full details.
For more information, see our LightningChart JS product page.
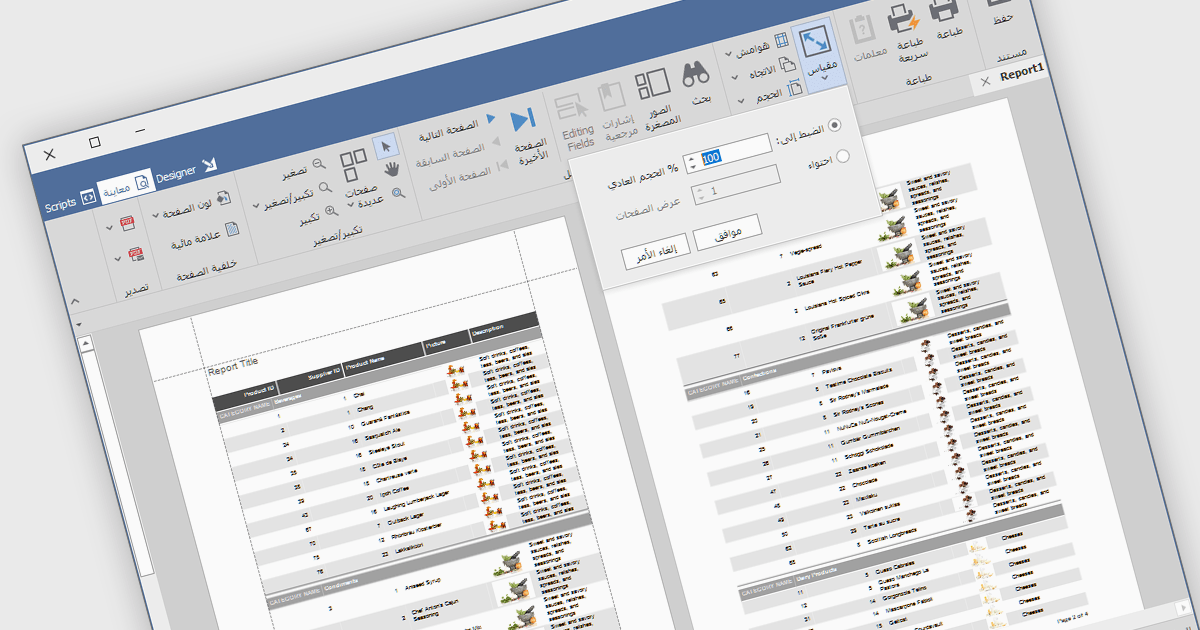
RTL support (Right-to-Left) enables the creation and viewing of reports that can accommodate languages that are read from right to left, such as Arabic, Hebrew, Persian, Urdu, and so on. In the context of report design, this involves aligning text, tables, charts, and interface elements in a way that respects the natural reading direction of said languages, so that the report is displayed correctly for the target audience. Support for RTL languages is a key capability for developers and organizations operating in multilingual environments, ensuring users working in these languages can design, view, and interpret reports accurately and comfortably within the reporting application.
Several Vue.js reporting components include RTL support, including:
For an in-depth analysis of features and price, visit our comparison of Vue.js reporting components.


Tel.: (888) 850 9911
Fax: +1 770 250 6199


