


Offizieller Lieferant
Als offizieller und autorisierter Distributor beliefern wir Sie mit legitimen Lizenzen direkt von mehr als 200 Softwareherstellern.
Sehen Sie alle unsere Marken.
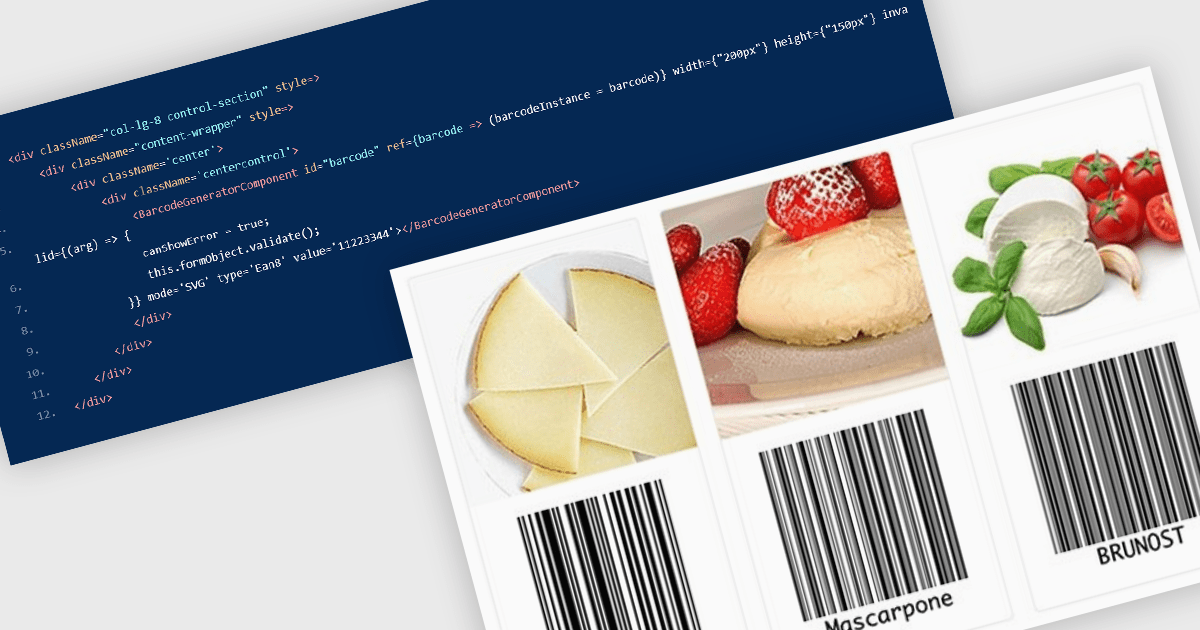
Barcode components in React UI suites deliver a easy way to integrate machine-readable encoding directly into modern web applications. These components offer a high-level interface for rendering both one-dimensional and two-dimensional barcodes, with customizable options for type (symbology), dimensions, styling, and export formats. They enable developers to choose between vector-based (SVG) or bitmap (Canvas) rendering, and often support direct exports to PNG, PDF, or SVG formats. Such features make barcodes a flexible integration point for inventory systems, shipping labels, ticketing, and other use cases requiring reliable, visual encoding of data within React environments.
Several React UI suites offer Barcode components including:
For an in-depth analysis of features and price, visit our React UI suites comparison.
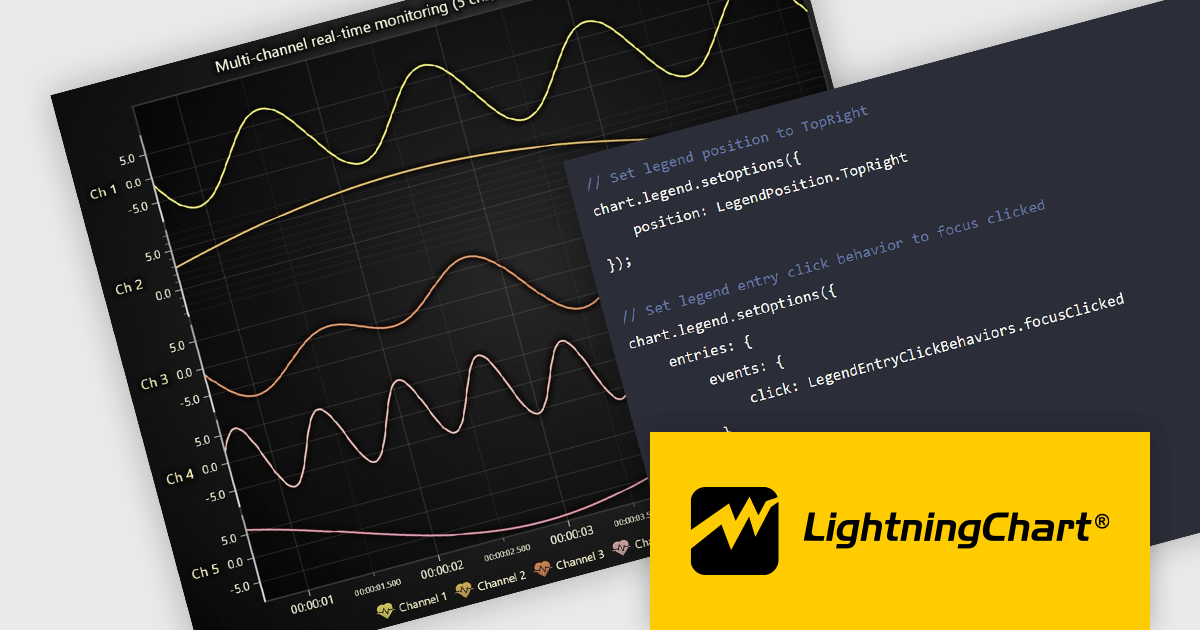
LightningChart JS is a high-performance JavaScript charting library that utilizes WebGL rendering and GPU acceleration to deliver exceptional performance for a wide range of data visualization needs. It is designed to handle large datasets and complex visualizations with ease, enabling developers to create interactive and visually appealing 2D and 3D charts. Ideal for applications demanding smooth real-time data updates, such as financial platforms, engineering tools, scientific research dashboards, and industrial monitoring systems, LightningChart JS provides a comprehensive API for customization and integration into web-based projects.
The LightningChart JS v8.0 update completely reworks legend functionality, making legends a property of the chart, removing visual obstructions, and improving adaptability to available space. The API configuration is now more intuitive and capable, with built-in options supporting a wider range of use cases. Plug‑in support also enables easy extension or customization of legend behavior. By default, legends now appear automatically beneath trends, reducing developer setup time, while still allowing you to manually create multiple legends when needed. You can position legends using built-in presets or define custom placements, and control click behavior using either the provided handlers or your own. When creating series, you can also exclude specific ones from appearing in legends, giving you fine-grained control over legend content.
To see a full list of what's new in v8.0, see our release notes.
LightningChart JS is licensed per developer and is available as an annual license with 1 year support. See our LightningChart JS licensing page for full details.
For more information, see our LightningChart JS product page.
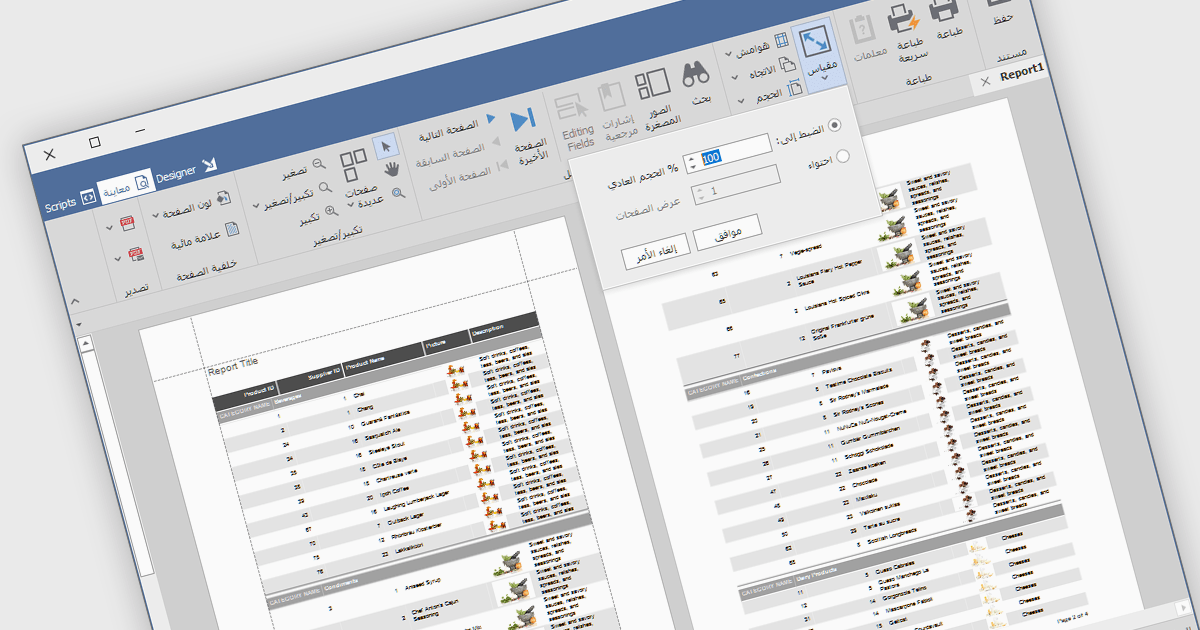
RTL support (Right-to-Left) enables the creation and viewing of reports that can accommodate languages that are read from right to left, such as Arabic, Hebrew, Persian, Urdu, and so on. In the context of report design, this involves aligning text, tables, charts, and interface elements in a way that respects the natural reading direction of said languages, so that the report is displayed correctly for the target audience. Support for RTL languages is a key capability for developers and organizations operating in multilingual environments, ensuring users working in these languages can design, view, and interpret reports accurately and comfortably within the reporting application.
Several Vue.js reporting components include RTL support, including:
For an in-depth analysis of features and price, visit our comparison of Vue.js reporting components.
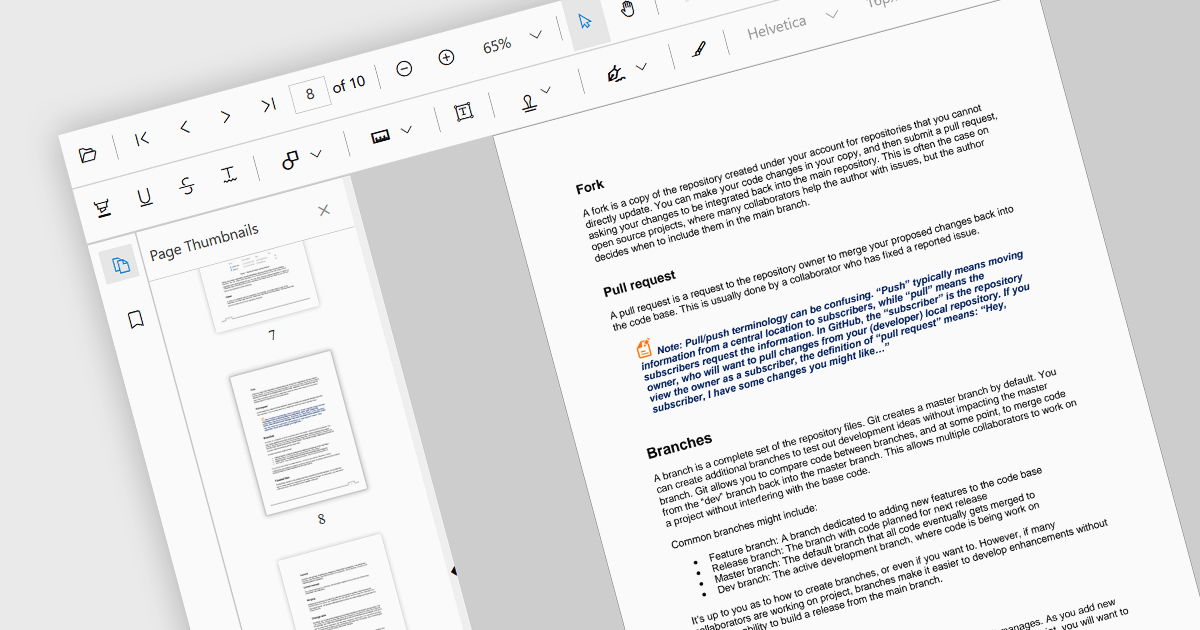
Thumbnail navigation is a feature often found in a PDF viewer that displays miniature representations of each page of the PDF file, typically in a side panel or dedicated section, that users can scroll through and navigate to the desired page by clicking on the relevant preview image. This functionality assists with identifying content layout and structure at a glance. By allowing users to visually scan through and select a specific page it simplifies the process of locating content at speed, especially in long or detailed files, and without having to scroll or use search functions.
Several React PDF viewer components offer thumbnail navigation, including:
For an in-depth analysis of features and price, visit our comparison of React PDF viewer components.
Froala Editor is a JavaScript-based WYSIWYG HTML editor that empowers developers to seamlessly integrate rich text editing functionalities into their applications. Despite its extensive feature set of over 100 options, Froala prioritizes user experience through a cleverly designed toolbar. Actions are categorized into four intuitive scopes, ensuring every feature is readily accessible while maintaining a clean and uncluttered interface. This balance of power and usability makes Froala Editor a versatile solution for a wide range of content creation scenarios.
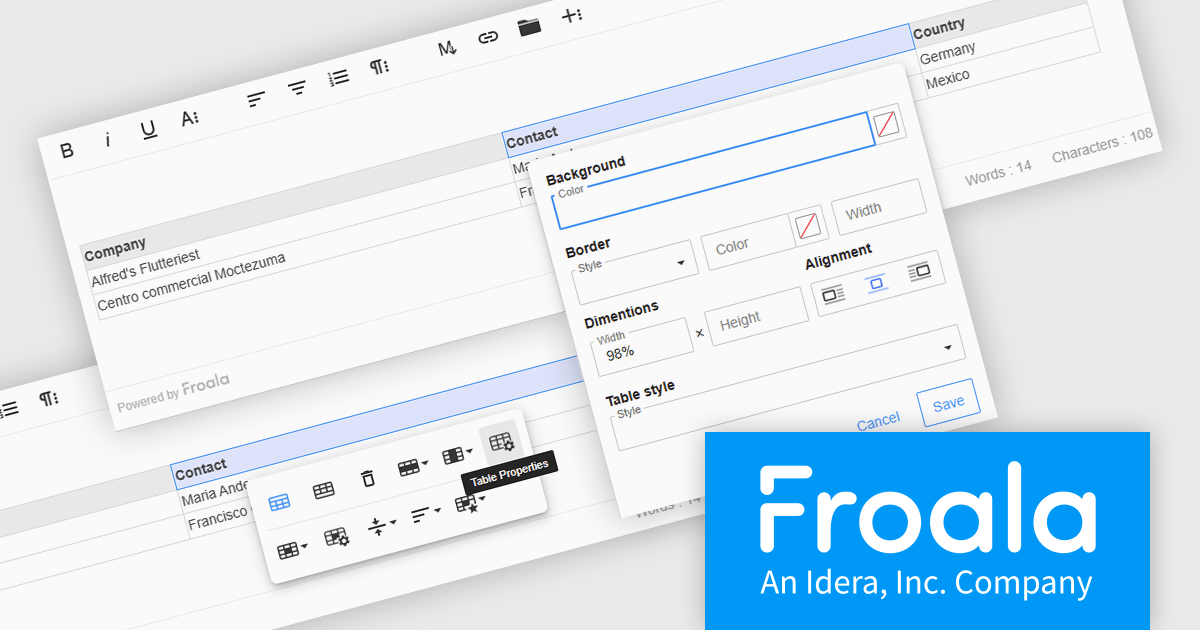
The Froala Editor 4.6.0 update introduces a highly configurable Table Properties modal that brings detailed table customization into a single, accessible interface. Activated via the table toolbar, this modal lets users set background colors using a color picker that supports both RGB and hex values, applying changes uniformly across all cells. Table borders can now be precisely styled with user-defined color, thickness, and style options such as solid, dotted, dashed, and more. Users can also define table width and height in pixels or percentages, ensuring responsive layouts that adapt to various screen sizes. Alignment controls allow tables to be positioned left, center, or right within the content area. For enhanced readability, especially in data-intensive scenarios, alternating row colors can be toggled on or off to visually separate content. This update gives developers and content creators the granular control needed to create well-structured and visually consistent tables.
To see a full list of what's new in 4.6.0, see our release notes.
Froala Editor is licensed per product and domain. It is available as an annual or perpetual license with version upgrades and support. See our Froala Editor licensing page for full details.
For more information, visit our Froala Editor product page.


Tel.: (888) 850 9911
Fax: +1 770 250 6199


