Offizieller Lieferant
Als offizieller und autorisierter Distributor beliefern wir Sie mit legitimen Lizenzen direkt von mehr als 200 Softwareherstellern.
Sehen Sie alle unsere Marken.

Financial apps can be significantly enriched by integrating open-high-low-close charts. These versatile visualizations condense price movement data into clear, concise bars, empowering users to rapidly grasp market trends and identify potential trading opportunities. With a quick glance, users can assess open, high, low, and closing prices within a chosen timeframe, gaining valuable insights into market sentiment and volatility. This immediate understanding fosters informed decision-making, transforming your Vue.js app into a dynamic platform for financial analysis and informed action.
Several Vue.js chart controls offer OHLC charts including:
For an in-depth analysis of features and price, visit our Vue.js chart controls comparison.

SpreadJS by MESCIUS is a powerful JavaScript library that lets you build Excel-like spreadsheets within your web applications. It offers tables, charts, formulas, pivot tables, and more, all running within the browser. It works with major frameworks like Angular, React, and Vue, and offers Excel file import and export. SpreadJS empowers developers to create interactive dashboards, analyze data, and streamline workflows, all within the familiar spreadsheet interface.
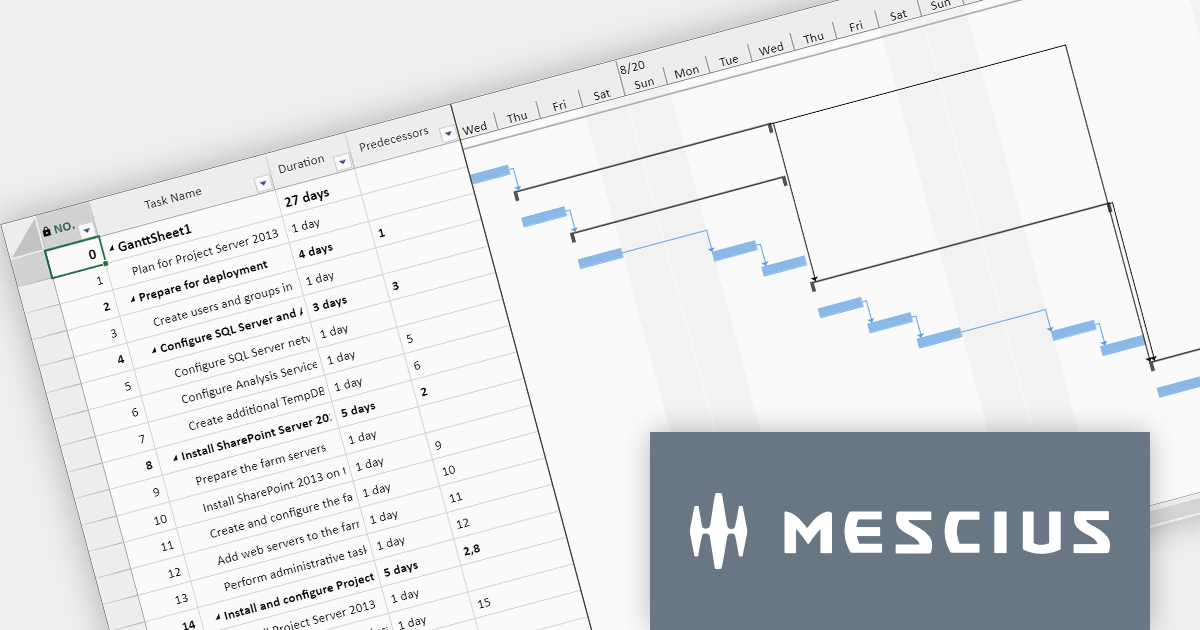
The SpreadJS 17 release introduces the optional GanttSheet Add-On, a full Gantt implementation that works inside of SpreadJS. It seamlessly integrates with your existing spreadsheets, transforming them into clear and concise Gantt charts. This allows you to visualize tasks, dependencies, and progress at a glance, identifying potential bottlenecks and adjust schedules proactively. GanttSheet offers a flexible and intuitive may to manage tasks, sort data, customize calendar settings, and even import/export plans for smooth collaboration.
To see a full list of what's new in version 17, see our release notes.
SpreadJS is licensed per developer and includes 1 Year Maintenance (major and minor version releases and unlimited support phone calls). SpreadJS requires an Annual or Perpetual Deployment License. The GanttSheet Add-On is available at an additional cost, and requires a SpreadJS license. See our SpreadJS licensing page for full details.
For more information, visit our SpreadJS product page.

IronPDF for Node.js lets you generate, edit, and extract PDF content in Node.js projects. It is designed for Node.js 12+ and is compatible with various operating systems including Windows, macOS and Linux, and IDEs such as JetBrains WebStorm and Microsoft Visual Studio Code. Its key features include generating PDFs programmatically using Node.js, creating PDFs from HTML, CSS, and JavaScript, adding headers/footers, watermarks or attachments to PDF documents, and securing PDFs using passwords, metadata and digital signatures.
IronPDF for Node.js is licensed per developer and is available as a perpetual license with 1 year of product updates and support services. Lite, Plus and Professional Licenses are available for different development and distribution requirements. See our IronPDF for Node.js licensing page for full details.
IronPDF for Node.js is available to buy in the following products:

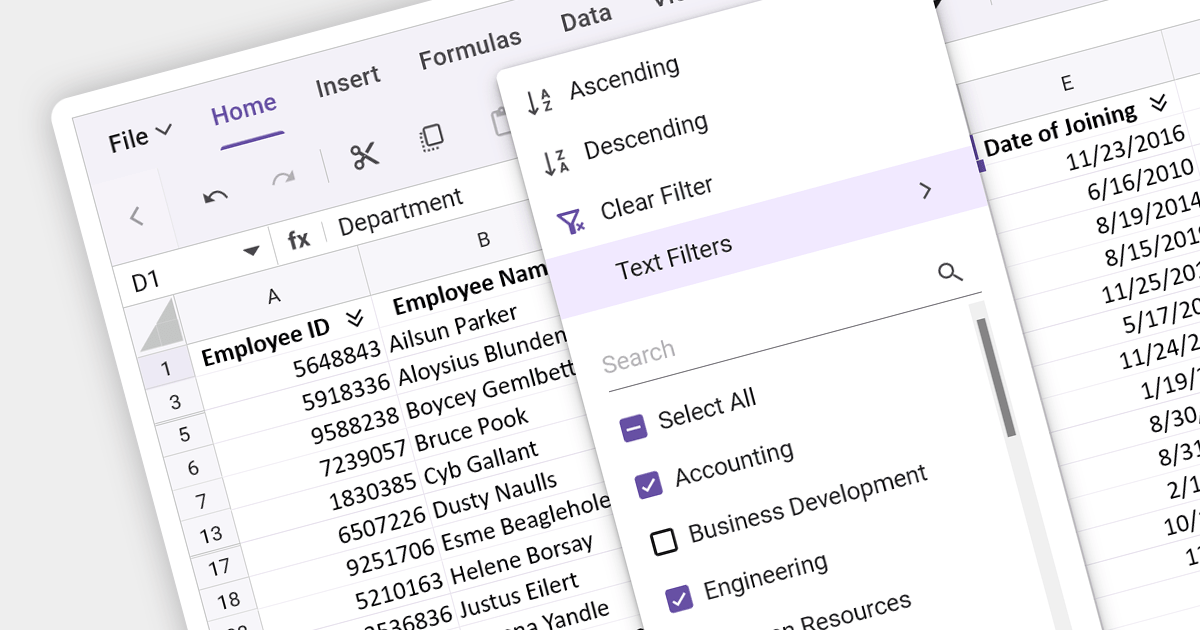
Data filtering and grouping are key spreadsheet features that allow users to manage and analyze large datasets efficiently. Filtering enables users to hide data that does not meet certain criteria, making it easier to focus on relevant information. Grouping clusters related data together, which can then be summarized with functions such as sum, average, and count. These features are vital for working with extensive spreadsheets, enabling users to simplify their view, and gain insights from specific subsets of data.
Several Angular Spreadsheet components provide data filtering and grouping support including:
For an in-depth analysis of features and price, visit our Angular Spreadsheet Component comparison.

Wijmo is a cross-platform UI JavaScript library that offers a comprehensive set of controls and tools for building rich, interactive web applications. Its components have zero dependencies and are written as lean TypeScript classes. Wijmo's key components include FlexGrid for data management, FlexChart for charting and data visualization, Input Controls for user input, and Report Viewer for creating and presenting reports.
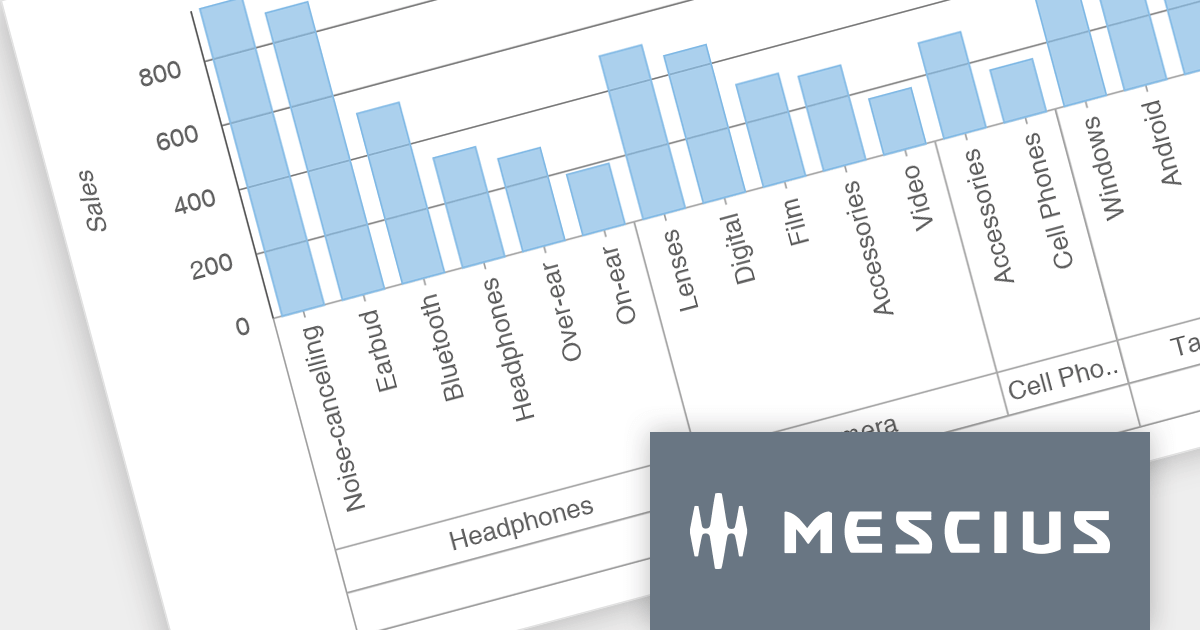
The Wijmo 2023 v2 release brings data grouping support to FlexChart. Axis grouping helps to organize complex data by visually separating it into categories or subcategories along the axis, making it easier to identify trends, patterns, and outliers within each group. While data grouping has long been a staple of Wijmo's CollectionView, users requested similar functionality in FlexChart, which MESCIUS has now incorporated. You can bind FlexChart to a grouped CollectionView and set the 'axis.groupsOptions' property to enable grouped labels in your charts.
To see a full list of what's new in version 2023 v2, see our release notes.
Wijmo is licensed per developer. Developer Licenses are perpetual and include 1 year Subscription which provides upgrades, including bug fixes and new features. See our Wijmo licensing page for full details.
For more information, visit our Wijmo product page.