


Offizieller Lieferant
Als offizieller und autorisierter Distributor beliefern wir Sie mit legitimen Lizenzen direkt von mehr als 200 Softwareherstellern.
Sehen Sie alle unsere Marken.
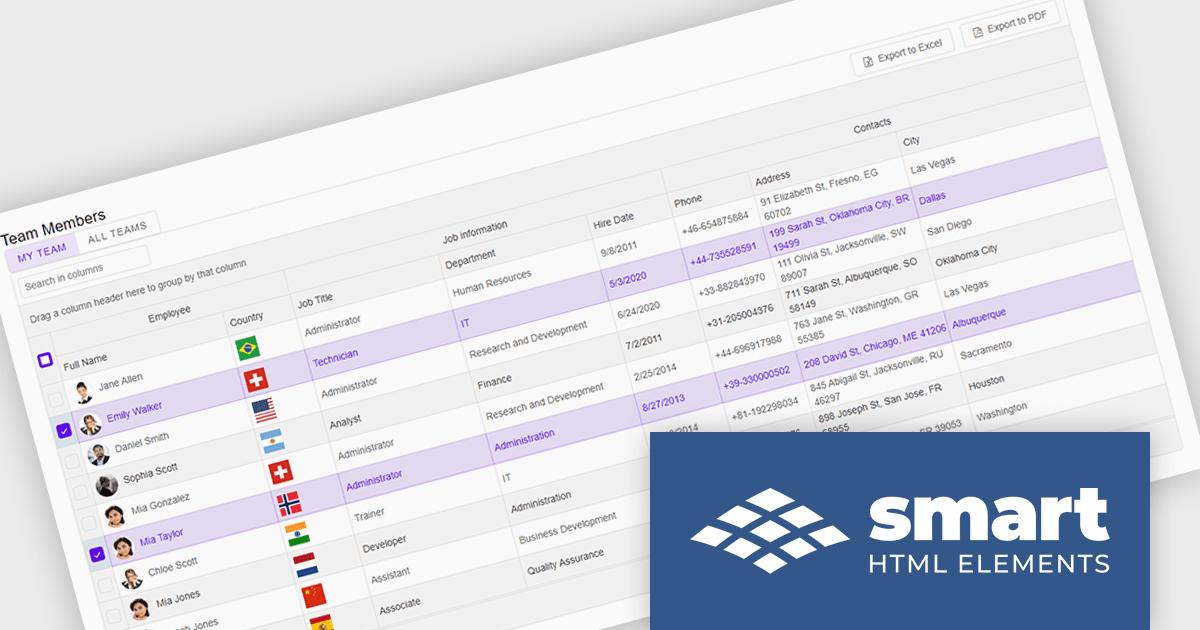
Smart UI by Smart HTML Elements is an enterprise-grade UI library offering pre-built web components for developers in Angular, React, Vue, Blazor, and JavaScript. It boasts over 60 ready-to-use components like grids, charts, schedulers, and editors, all featuring two-way data binding, responsiveness, accessibility, and theming capabilities. This library helps developers rapidly build dynamic and modern web applications with consistent look-and-feel and rich functionalities, accelerating development time and ensuring professional quality.
The Smart UI v21.0.0 release introduces significant enhancements to grid Excel export functionality. Users can now export one or more images from grids or components directly into Excel files and limit exports to selected rows or cells. These features provide greater flexibility, enabling users to include precisely the data they need while adding visual context to enhance understanding. The ability to tailor exports in this way ensures clearer communication of the underlying meaning and significance of the data.
To see a full list of what's new in v21.0.0, see our release notes.
Smart UI (Smart HTML Elements) is licensed per developer and is available as a perpetual license with 1 year support and maintenance. It includes distribution to unlimited Web applications, SaaS projects, Intranets and Websites. Team, OEM and Enterprise licensing options are also available. See our Smart UI licensing page for full details.
Learn more on our Smart UI product page.
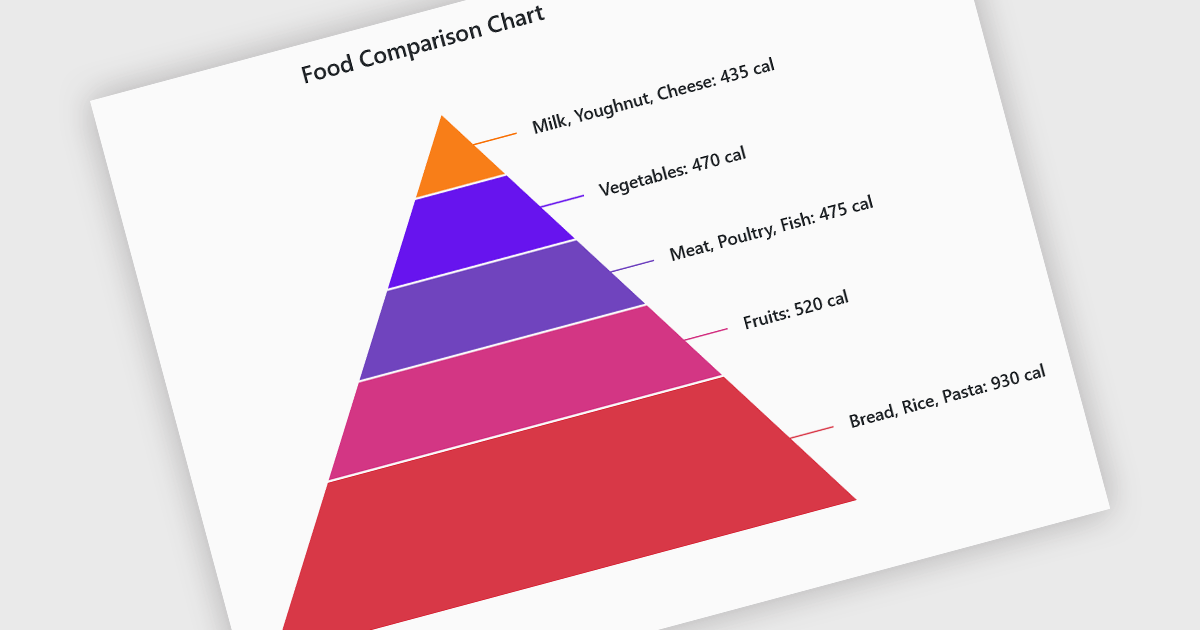
Pyramid charts are a type of graphical representation that organizes data hierarchically, with each layer of the pyramid representing a category or level within the dataset. These charts are particularly useful for displaying proportions, relationships, or workflows where data is segmented into tiers, such as organizational structures, population distributions, or sales funnels. Their clear visual hierarchy makes it easy to compare the relative size of categories or levels at a glance. Pyramid charts are beneficial in highlighting the relative contribution of parts to a whole, visualizing attrition or progression across stages, and presenting data in an intuitive and compact format. Popular use cases include illustrating business sales funnels, demographic distributions in marketing, and resource allocation in project management, making them a versatile tool in both strategic planning and data analysis.
Several Blazor chart controls offer pyramid charts including:
For an in-depth analysis of features and price, visit our Blazor chart controls comparison.
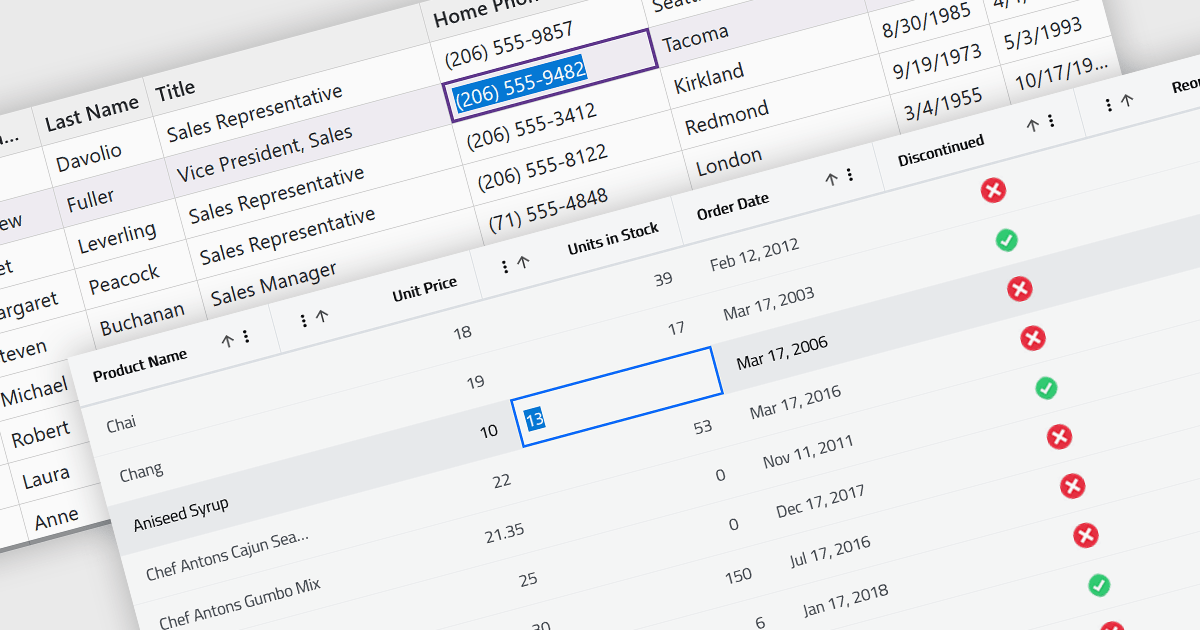
Inline editing in a grid is a user-friendly feature that allows users to edit data directly within the grid interface, without needing to open separate forms or dialogs. This means that data can be modified in place, streamlining workflows by reducing the steps required to make updates. Inline editing is particularly beneficial in scenarios where users need to quickly edit multiple records, such as updating inventory quantities, modifying project statuses, or correcting data errors in real time. By providing immediate visual feedback and maintaining the context of the data set, inline editing enhances productivity and minimizes the risk of disruptions. It is commonly used in applications like content management systems, project management tools, and enterprise resource planning (ERP) systems where efficiency and ease of use are critical.
Several Blazor grid controls offer support for inline editing including:
For an in-depth analysis of features and price, visit our Blazor grid controls comparison.
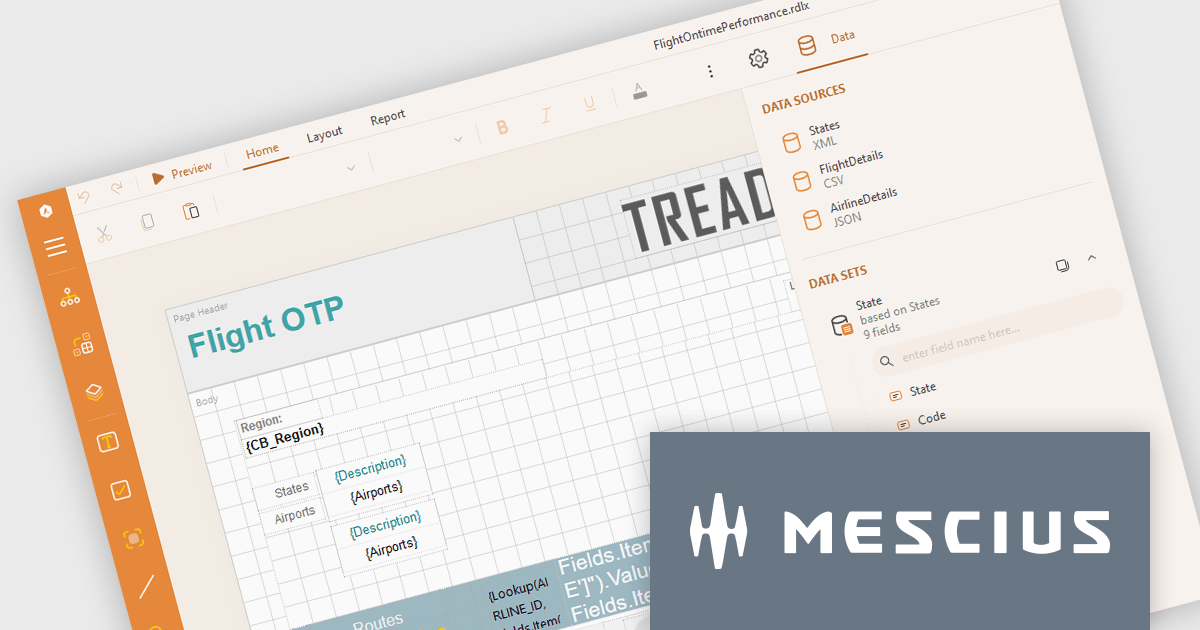
ActiveReports.NET from MESCIUS, is a comprehensive reporting solution for developers building applications in .NET. It empowers you to design and deliver visually appealing reports through user-friendly designers and a wide range of controls. ActiveReports simplifies report creation and distribution with a versatile API, rich data source connectivity, and support for multiple export formats. This translates to increased developer productivity and improved end-user experience with powerful reporting functionalities within your .NET applications.
The ActiveReports.NET v18.2 update enhances the XML Data Display in the Web Designer by introducing a tree structure for data fields, making it significantly easier to navigate and understand complex XML data. This intuitive format allows developers to quickly explore hierarchical data structures, streamlining the data binding process and reducing the effort required to interpret XML data. As a result, developers can focus more on designing reports efficiently rather than spending time deciphering the data itself, leading to a more productive and user-friendly report development experience.
To see a full list of what's new in 18.2, see our release notes.
ActiveReports.NET is licensed per developer and is available with or without a 12 month support and maintenance subscription. See our ActiveReports.NET licensing page for full details.
Learn more on our ActiveReports.NET product page.
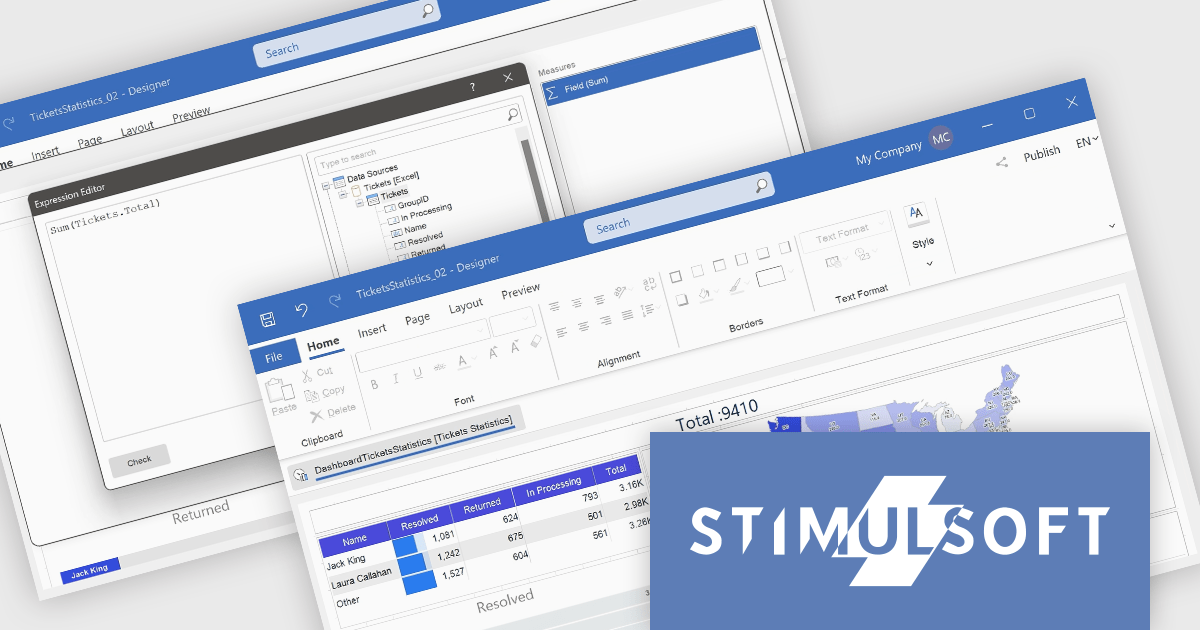
Stimulsoft Dashboards.WEB is a versatile suite of tools for crafting interactive data visualizations for web and desktop applications. It empowers developers to embed intuitive dashboards across various platforms, using the platform-specific components or a centralized cloud designer. With rich data analysis elements, extensive customization options, and pre-built templates, Stimulsoft Dashboards helps you transform complex data into clear, actionable insights for any audience.
The Stimulsoft Dashboards.WEB 2024.4.1 release adds the ability to create Measures within the Text dashboard element, which significantly enhances the flexibility and functionality of dashboards by allowing users to dynamically incorporate calculated values into text elements. This feature enables more informative and contextualized reports, as users can seamlessly display and update relevant metrics directly within the text, eliminating the need for separate data visualization components. This not only streamlines dashboard creation but also improves data accessibility and understanding for end-users.
To see a full list of what's new in 2024.4.1, see our release notes.
Stimulsoft Dashboards.WEB is licensed per developer and is available as a perpetual license with 1 year support and maintenance. See our Stimulsoft Dashboards.WEB licensing page for full details.
Stimulsoft Dashboards.WEB is available in the following products:


Tel.: (888) 850 9911
Fax: +1 770 250 6199


