


Offizieller Lieferant
Als offizieller und autorisierter Distributor beliefern wir Sie mit legitimen Lizenzen direkt von mehr als 200 Softwareherstellern.
Sehen Sie alle unsere Marken.
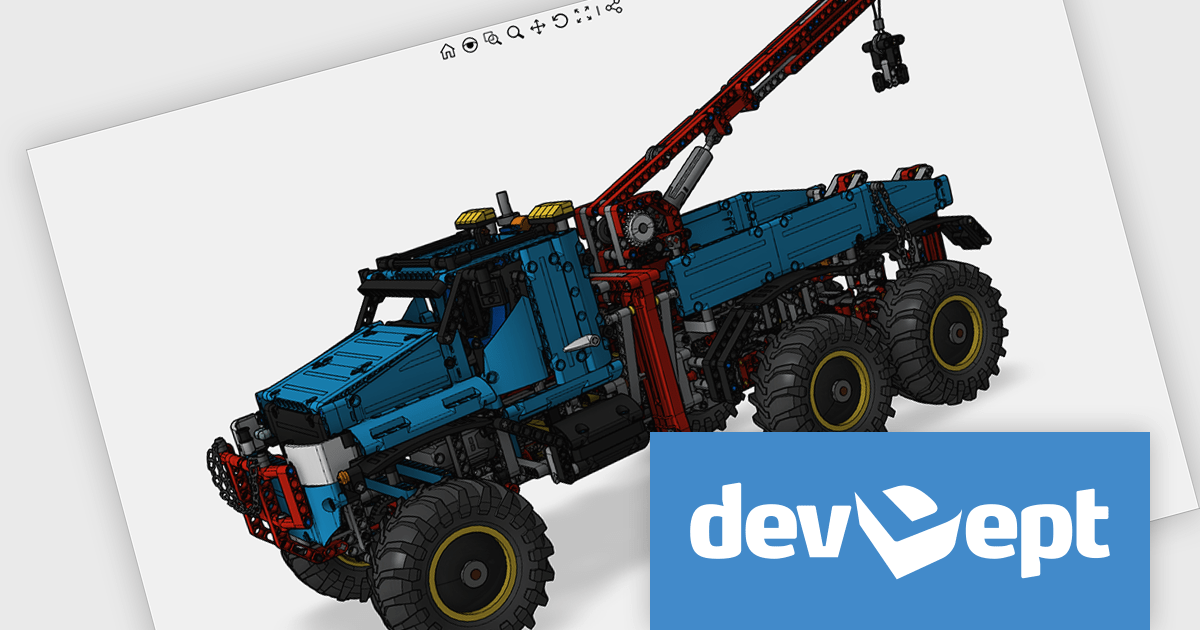
Eyeshot by devDept Software empowers you to integrate robust CAD functionalities into your .NET applications. Supporting both Windows Forms and WPF natively, it offers a comprehensive suite of tools accessible through the Visual Studio toolbox. These include Design for 2D/3D geometry creation and editing, Drawing for automatic 2D view generation, Simulation for geometry validation, and Manufacture for CNC toolpath generation and simulation.
The Eyeshot 2024.2 release introduces a valuable new feature: the ScaleBar UI element. This on-screen tool acts as a visual ruler within your modelling environment, providing a quick and easy way to estimate the size of your 3D geometry directly in the viewport. Especially useful in the early design stages, the ScaleBar eliminates guesswork and ensures your model aligns with real-world dimensions. This streamlines your workflow by allowing you to design with confidence, knowing the true size of your objects at a glance.
To see a full list of what's new in version 2024.2, see our release notes.
Eyeshot is licensed per developer and is available as an annual license, with either Lite or Priority support. See our licensing pages for Eyeshot Pro, Eyeshot Ultimate, and Eyeshot Fem for full details.
Eyeshot is available to buy in the following products:
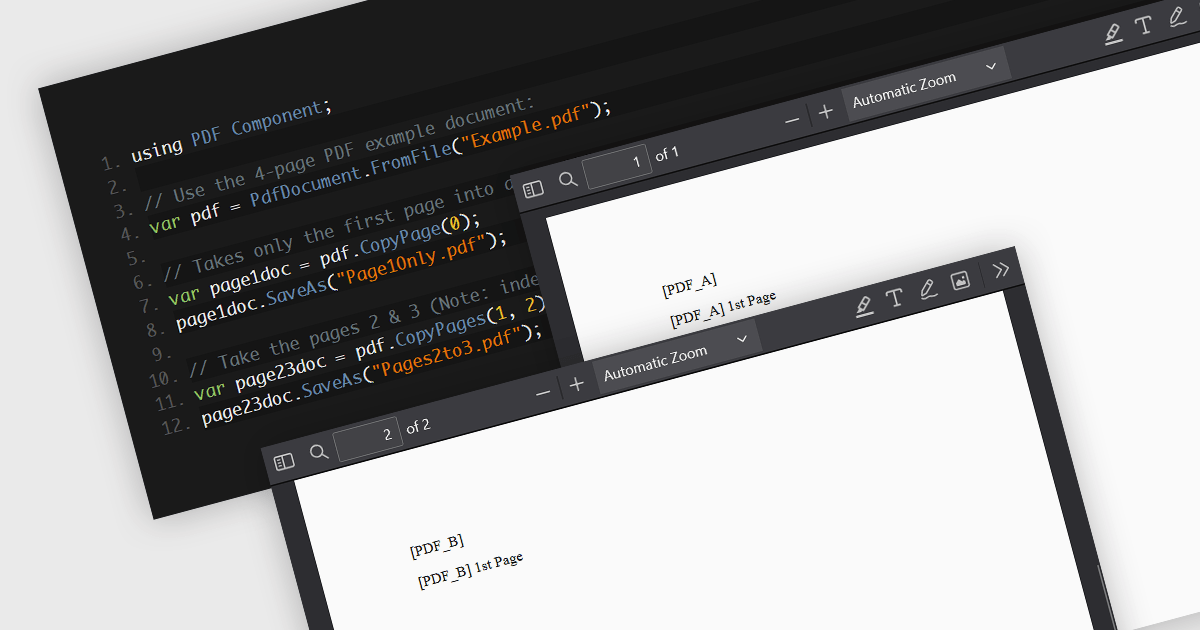
PDF splitting functionality enables users to divide a single PDF document into multiple smaller files, each containing a subset of the original document's pages. This capability is essential for managing large PDFs by breaking them down into more manageable sections, facilitating easier distribution, storage, and retrieval of specific content. The primary benefits of PDF splitting include improved performance due to reduced file size, enhanced organization by isolating relevant information, and increased flexibility in handling and sharing parts of the document without the need to manipulate the entire file. It can also simplify collaboration and review processes, as specific sections can be easily extracted and shared with relevant stakeholders.
Several .NET PDF components allow you to split PDF files, including:
For an in-depth analysis of features and price, visit our comparison of .NET PDF components.
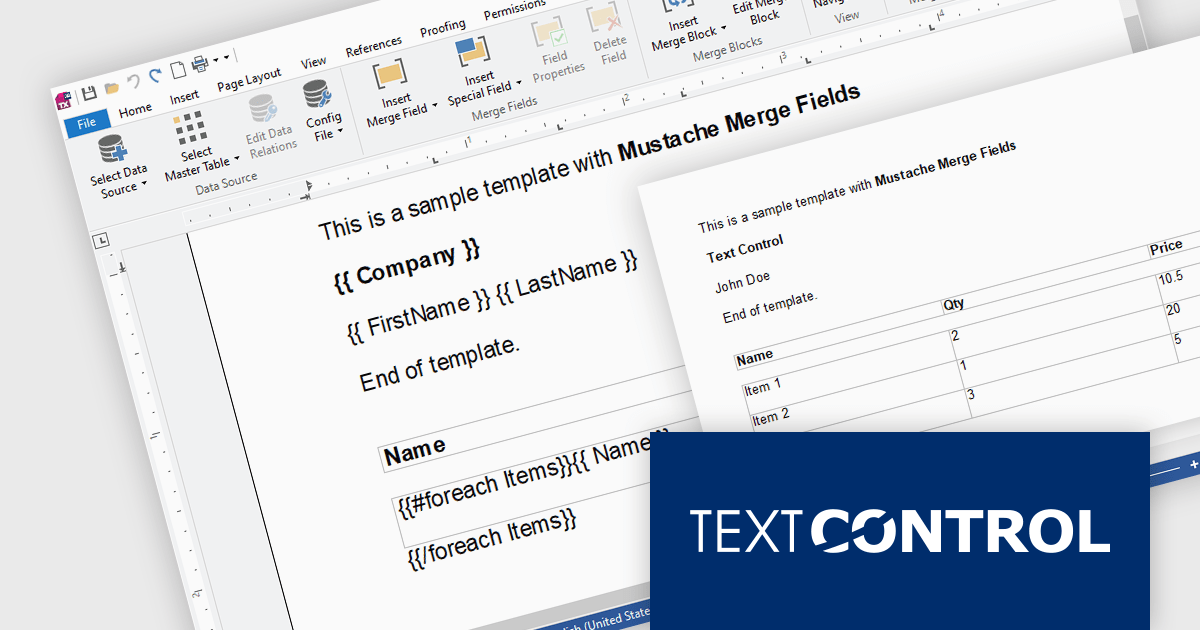
TX Text Control .NET Server for ASP.NET is a server-side component that equips developers with a powerful word processing engine for web applications. It integrates seamlessly with ASP.NET, ASP.NET Core, popular frameworks like Angular and React, and JavaScript, allowing you to build dynamic document editing and generation features directly within your web applications. This empowers you to create documents on the fly using data from various sources, edit existing documents in the browser, and handle functionalities like PDF processing and form filling, all on the server-side.
Mail Merge is a fundamental requirement for word processing applications. In this blog post, Text Control's Bjoern Meyer shows you to use Mustache Syntax with your TX Text Control web applications to insert merge fields into templates in formats that do not support MS Word merge fields, such as TXT or HTML. He also demonstrates how to use merge block to repeat content based on a collection of items. Detailed code is included to get you on your way.
Read the full blog and discover the power of using mustache syntax along with TX Text Control's MailMerge engine.
TX Text Control .NET Server for ASP.NET is licensed per Developer and includes Run-time licensing for up to 5 Servers. Licensing is perpetual, and include a 1-year subscription. See our TX Text Control .NET Server for ASP.NET licensing page for more details.
Learn more about TX Text Control .NET Server for ASP.NET.
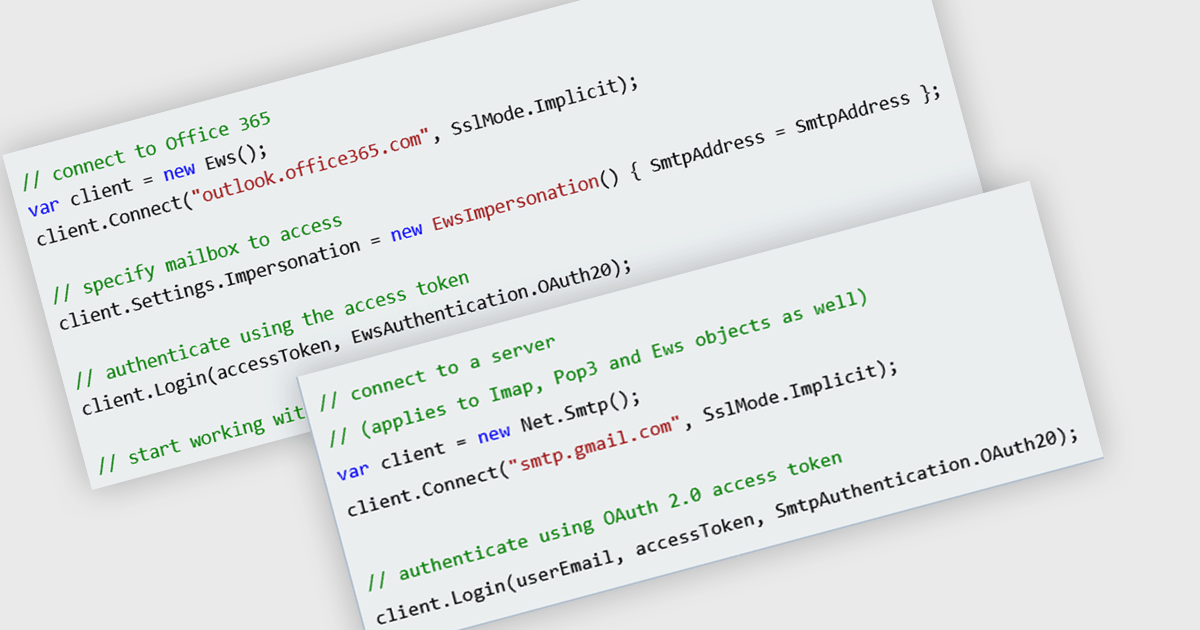
OAuth support in a comms and messaging component signifies the ability to leverage external accounts for user authentication. OAuth (Open Authorization) offers several advantages: increased security by eliminating the need for separate login credentials, improved user experience with familiar login options, and potential access to additional user data (with proper authorization) for richer communication features. For instance, a messaging app could allow login via social media accounts, enabling users to connect with existing contacts without the need to create and remember a new account password.
Several .NET communications and messaging components offer OAuth support including:
For an in-depth analysis of features and price, visit our comparison of .NET communications and messaging components.
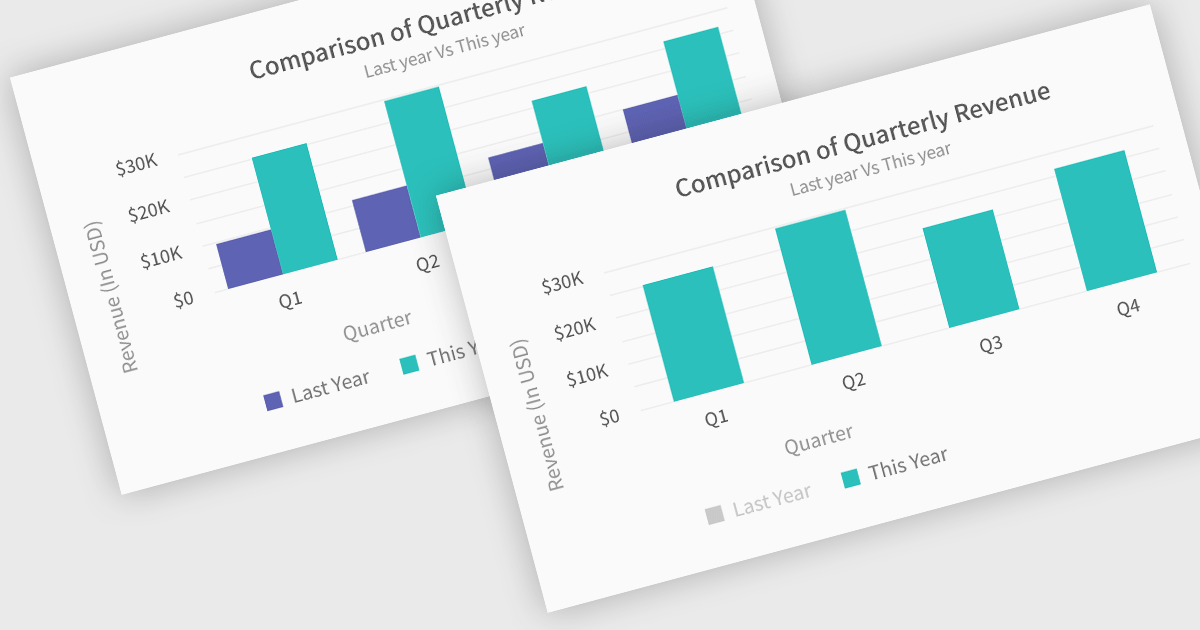
In chart controls, show/hide series functionality empowers developers to dynamically control the visibility of individual data sets. This allows users to focus on specific series, enhancing data comprehension and analysis. By selectively hiding irrelevant series, developers can declutter the chart, making it easier for users to identify trends and patterns within the data of interest.
Several .NET Blazor chart controls offer show/hide series support including:
For an in-depth analysis of features and price, visit our .NET Blazor chart controls comparison.


Tel.: (888) 850 9911
Fax: +1 770 250 6199


