


Offizieller Lieferant
Als offizieller und autorisierter Distributor beliefern wir Sie mit legitimen Lizenzen direkt von mehr als 200 Softwareherstellern.
Sehen Sie alle unsere Marken.
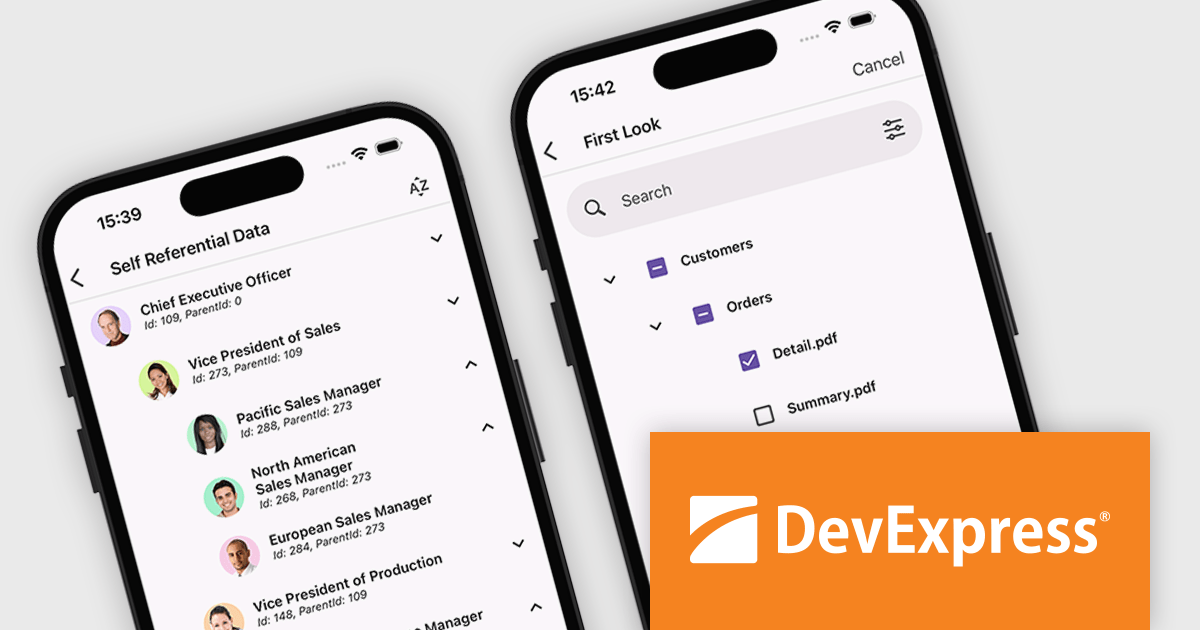
DevExpress .NET MAUI is a collection of high-performance UI components specifically designed to build native cross-platform apps for iOS and Android using the .NET MAUI framework. From advanced data grids and charts to intuitive data editors and smooth PDF viewing, it empowers developers to quickly and easily craft feature-rich mobile experiences.
Version 24.1 adds an all-new TreeView control. This powerful feature lets you effortlessly display complex information in a user-friendly, hierarchical format. Ideal for visualizing intricate file structures, organizational charts, or nested data sets, the TreeView control provides a clear and intuitive way to navigate and explore information. You can even leverage it to build dynamic navigation menus within your applications. This addition to the .NET MAUI toolkit streamlines data presentation and enhances the overall user experience of your cross-platform apps.
To see a full list of what's new in version 24.1, see our release notes.
DevExpress .NET MAUI is included as part of DevExpress Universal which is licensed per developer and is available as a Perpetual License with a 12 month support and maintenance subscription. See our DevExpress Universal licensing page for full details.
DevExpress .NET MAUI is available in the following products:

ONLYOFFICE Docs is a comprehensive online editor, allowing users to create text documents, spreadsheets, presentations, and forms. It enables your users to edit, share, and collaborate on documents online in their preferred browser, within your own application. It's fully compatible with OOXML (Office Open XML) formats and supports popular Microsoft Office and other document formats such as CSV, DOC, DOCX, EPUB, HTML, ODP, ODS, ODT, PDF, PPT, PPTX, RTF, TXT, XLS, and XLSX.
The ONLYOFFICE Docs v8.1.0 update enhances the native PDF editor with text editing capability. This new feature improves the workflow for developers integrating ONLYOFFICE Docs into their applications. It allows them to directly edit text within PDF files, ensuring an improved user experience for seamless content modifications, without the need for external tools. This update provides a more integrated and streamlined approach to document editing, catering to the needs of developers seeking robust and reliable PDF editing capabilities within their software solutions.
To see a full list of what's new in v8.1.0, see our release notes.
ONLYOFFICE Docs is licensed by the number of simultaneous document connections and is available as an annual license with 1 year support and upgrades. See our ONLYOFFICE Docs licensing page for full details.
For more information, see our ONLYOFFICE Docs product page.
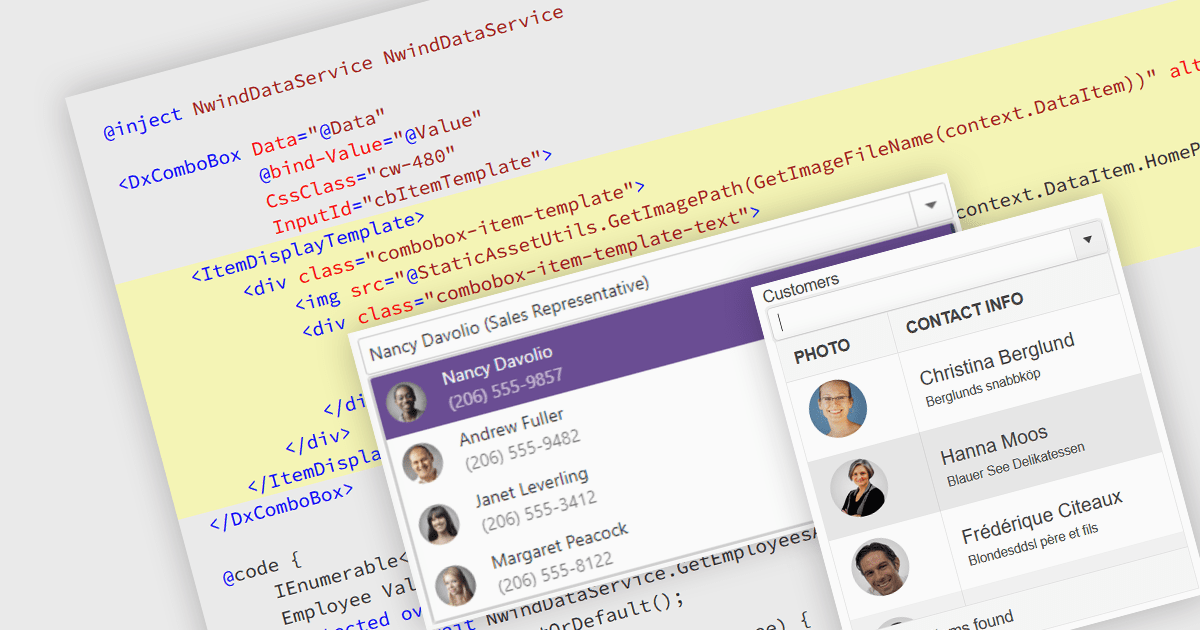
An image combobox is a custom UI component that combines a traditional dropdown menu with the ability to display an image alongside each item. Image comboboxes can enhance user experience by providing a more intuitive way to identify and select options, especially for items that benefit from visual representation. This approach can be particularly useful for non-text-based data or for catering to users who prefer visual cues. Image comboboxes are valuable for tasks like selecting product variations based on color or choosing countries with a flag icons.
Several ASP.NET Core data editor controls support image combobox functionality, including:
For an in-depth analysis of features and price, visit our ASP.NET Core data editors comparison.
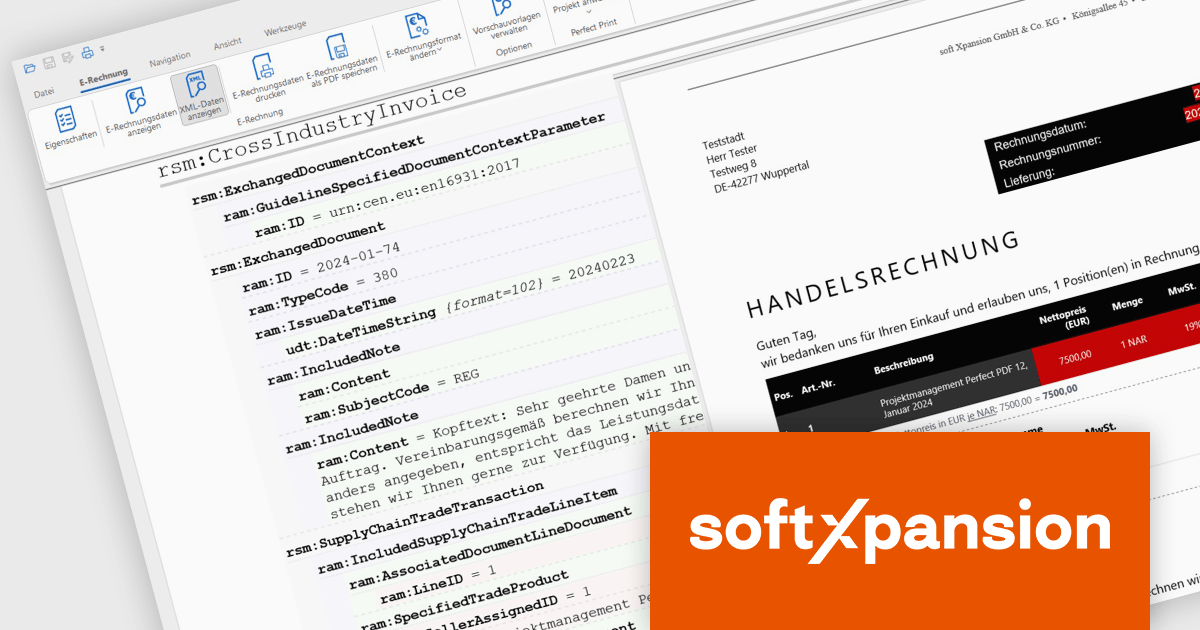
Soft Xpansion's PDF Xpansion SDK E-Invoicing equips developers with tools for integrating electronic invoice functionalities into their applications. This SDK supports processing common e-invoice formats like ZUGFeRD, Factur-X, and XRechnung. Developers can leverage functionalities for creating, editing, and displaying compliant invoices within their software. Additionally, the SDK facilitates data extraction from these invoices, enabling seamless integration with accounting or enterprise resource planning (ERP) systems.
PDF Xpansion SDK E-Invoicing 16.2.7 introduces new add-ons to enhance the processing of EU-Compliant invoices. The Non-West European Language Add-on (ISO 8859-2, 3, 4, 5, 7, 9, 10, 13, 14, 15, 16 encoding) supports special characters in languages like Central and partly Southeast European, predominantly Slavic, but also Turkish, Maltese, North European like Estonian/Latvian/Lithuanian, plus East European Cyrillic, Greek, Albanian, Croatian, Hungarian, Polish etc.
The new UBL Syntax Support Add-on (additional to the default UN/CEFACT support) lets your applications both create electronic (XML) invoices in that syntax and enables your applications to read XML invoices that are written in UBL.
The European standard for electronic invoicing (EN 16931) currently specifies both UBL and UN/CEFACT CII as possible syntax versions. Both are XML based syntaxes. However, there are also differences between the two: The German XRechnung format supports both syntaxes, while ZUGFeRD/Factur-X only supports UN/CEFACT.
UBL is part of various other national e-invoicing standards such as NESUBL in Northern Europe or Elektronisk Handelsformat in Norway. Many document types can be handled with the UBL syntax: In addition to invoices, this also includes orders and price lists, for example. In contrast to that, the UN/CEFACT syntax is limited to invoices.
PDF Xpansion SDK E-Invoicing is available in 3 variations, licensed per company location where developers use the SDKs. Optional Add-Ons are available which require ownership of SDK site licenses. Maintenance Subscription is available providing product updates (error corrections) and 12 man hours of support service for 1 year. See the product license pages for full details:
Learn more about PDF Xpansion SDK E-Invoicing on our product pages:
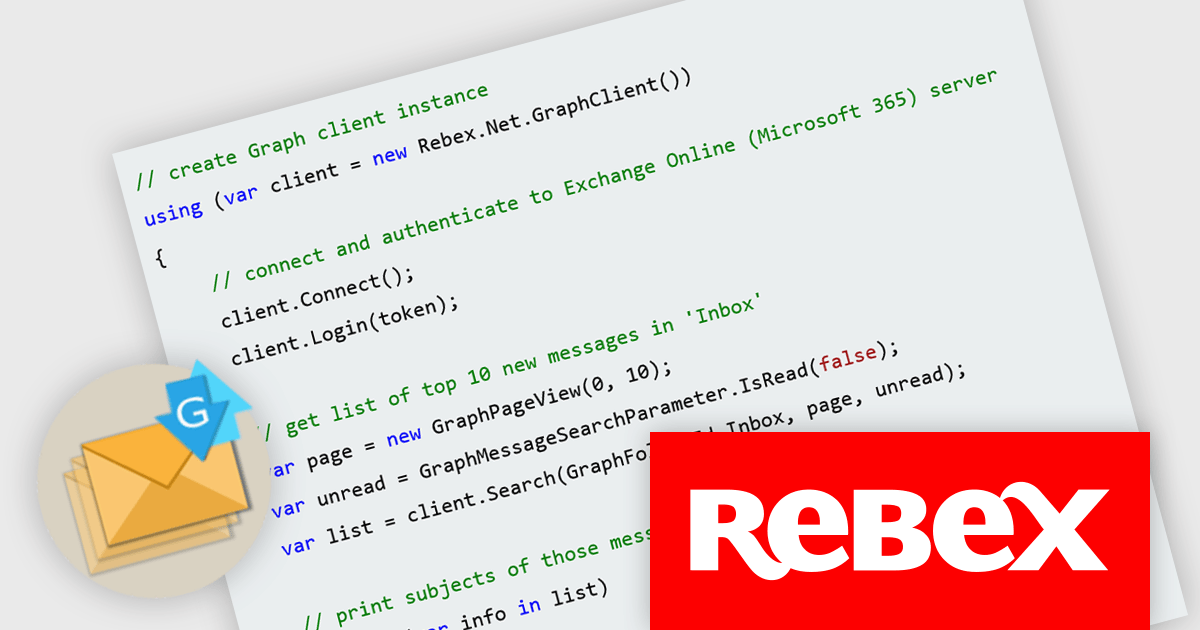
Rebex Graph is a powerful new .NET library designed to simplify working with Microsoft Graph, the central API for accessing Microsoft 365 services. It streamlines interaction with Exchange Online, a core component of Microsoft 365, enabling developers to leverage functionalities like sending, receiving, listing, and searching emails directly within their applications.
This streamlined access to Exchange Online unlocks a multitude of benefits for developers. Rebex Graph empowers them to build efficient email-centric applications without the need to deal with the complexities of the underlying protocols. It supports the latest security measures like TLS 1.3/1.2 and S/MIME, ensuring robust communication and data protection. These features make Rebex Graph a valuable tool for developers seeking to integrate secure and reliable email capabilities into their .NET applications.
Rebex Graph is licensed per developer and is available as a Perpetual License with a 1 Year Support Contract which includes priority support and all software updates. See our Rebex Graph licensing page for full details.
Learn more on our Rebex Graph product page.


Tel.: (888) 850 9911
Fax: +1 770 250 6199


