


Offizieller Lieferant
Als offizieller und autorisierter Distributor beliefern wir Sie mit legitimen Lizenzen direkt von mehr als 200 Softwareherstellern.
Sehen Sie alle unsere Marken.
LightningChart .NET is a high-performance data visualization library designed for .NET developers working with WPF, WinForms, and UWP applications. It offers GPU-accelerated rendering for smooth real-time visualization of massive datasets, exceeding billions of data points. This library supports a wide variety of chart types, including 2D, 3D, polar, and geographic maps, along with extensive customization options for each. LightningChart .NET is a powerful tool for developers creating demanding data visualization applications requiring exceptional performance.
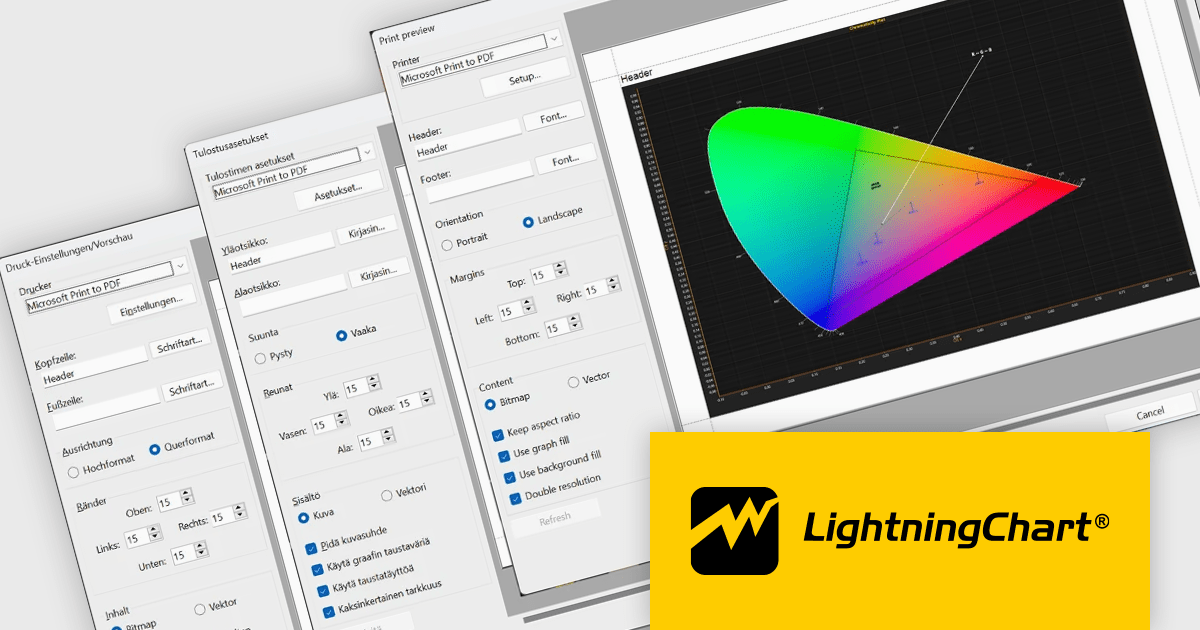
LightningChart .NET provides multilingual support for the WinForms Print Preview dialog, enabling developers to deliver a more localized and user friendly printing experience for international users. With support for English, German, and Finnish, and the option to add additional languages upon request, applications can better meet regional requirements, improve usability, and reduce the learning curve for users working in their preferred language.
LightningChart .NET is available per developer in packages for either WPF, WinForms, UWP or all 3. Each package comes as a subscription license (with 1 or 2 years of limited support), or a perpetual license (with 1 or 2 years of Standard or Premium support). Floating licenses and site licenses are available upon request. See our LightningChart .NET licensing page for full details.
Learn more on our LightningChart .NET product page.
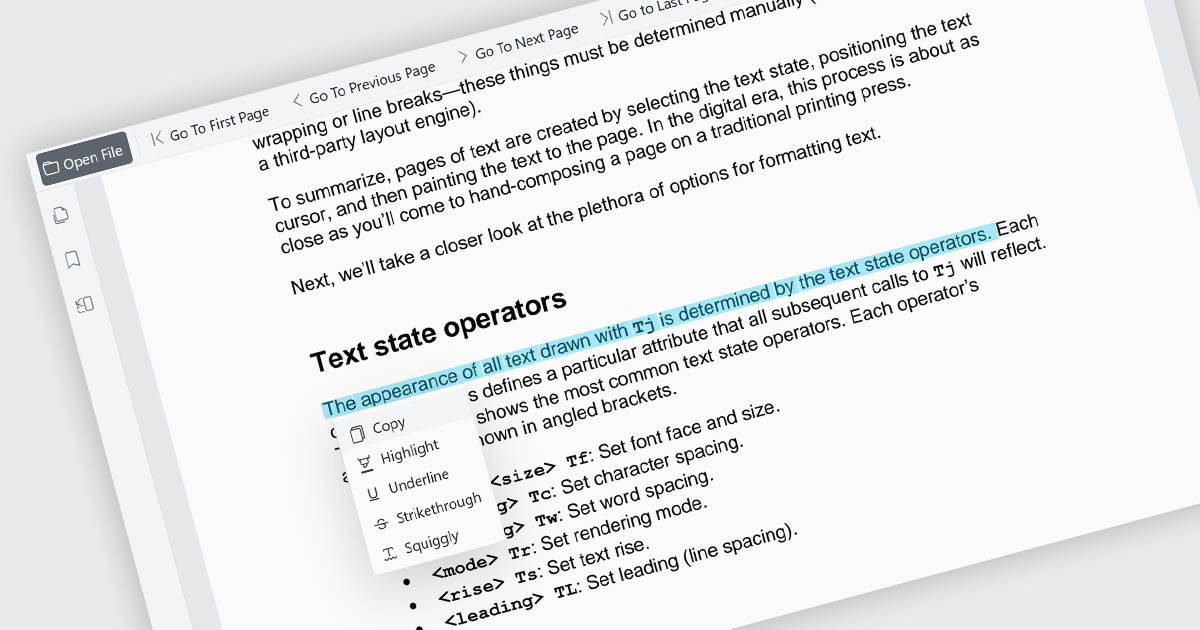
The ability to select and copy text directly within a PDF viewer allows users to highlight content and transfer it to other applications without leaving the document. This functionality enables the efficient extraction of information from PDF files, reducing the need to manually retype content and helping to minimize errors. It supports a wide range of use cases, including research, document review, content reuse, and collaboration across teams. This capability improves productivity by making it easier to reuse information, extract key details, support research activities, and incorporate content into reports, emails, presentations, or other business documents while maintaining an efficient reading experience. It also enhances accessibility and usability by allowing users to interact with document content in a more flexible and practical manner.
Several Blazor PDF viewer components allow you to select and copy text, including:
For an in-depth analysis of features and price, visit our comparison of Blazor PDF viewer components.
DevExpress Universal is a comprehensive suite of UI components and developer tools that supports the creation of feature-rich applications across web, desktop, and mobile platforms, including .NET, JavaScript, Blazor, ASP.NET, WinForms, WPF, and MAUI. It focuses on delivering consistent user interfaces, advanced data visualization, reporting, dashboards, and productivity features that help teams design, build, and maintain complex applications using a unified set of technologies and patterns.
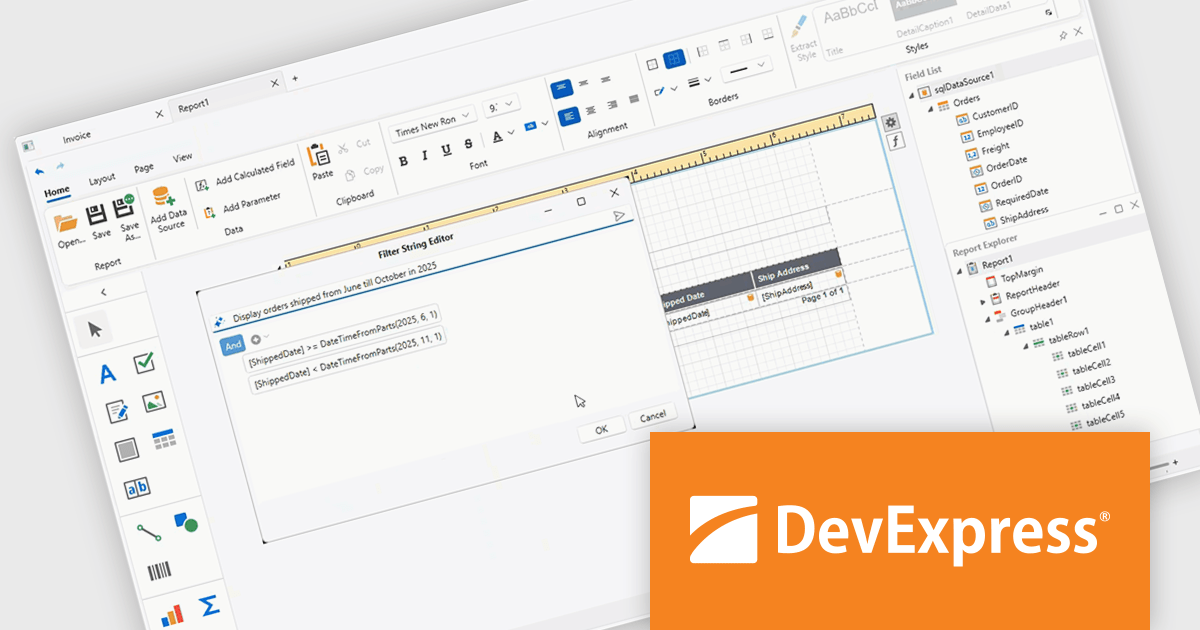
DevExpress Universal 26.1 improves the WPF Report Designer with AI-assisted expression generation within both the Expression Editor and Filter String Editor. Instead of manually writing complex Criteria Language expressions, users can simply describe the required business logic in natural language and have the expression generated automatically. This capability helps reduce the learning curve for advanced reporting features, accelerates report creation, and makes it easier for developers and business users alike to build filters, calculated fields, and other expression-based functionality with greater confidence and accuracy.
DevExpress Universal is licensed per developer and is available as a Perpetual License with a 12 month support and maintenance subscription. See our DevExpress Universal licensing page for full details.
For more information, visit our DevExpress Universal product page.
Infragistics Ultimate is a comprehensive development toolkit designed to improve the creation of high-performance, visually rich applications across multiple platforms. It includes a wide range of user interface (UI) components and development tools for web, desktop, and mobile applications, supporting frameworks such as Angular, React, Blazor, .NET, and more.
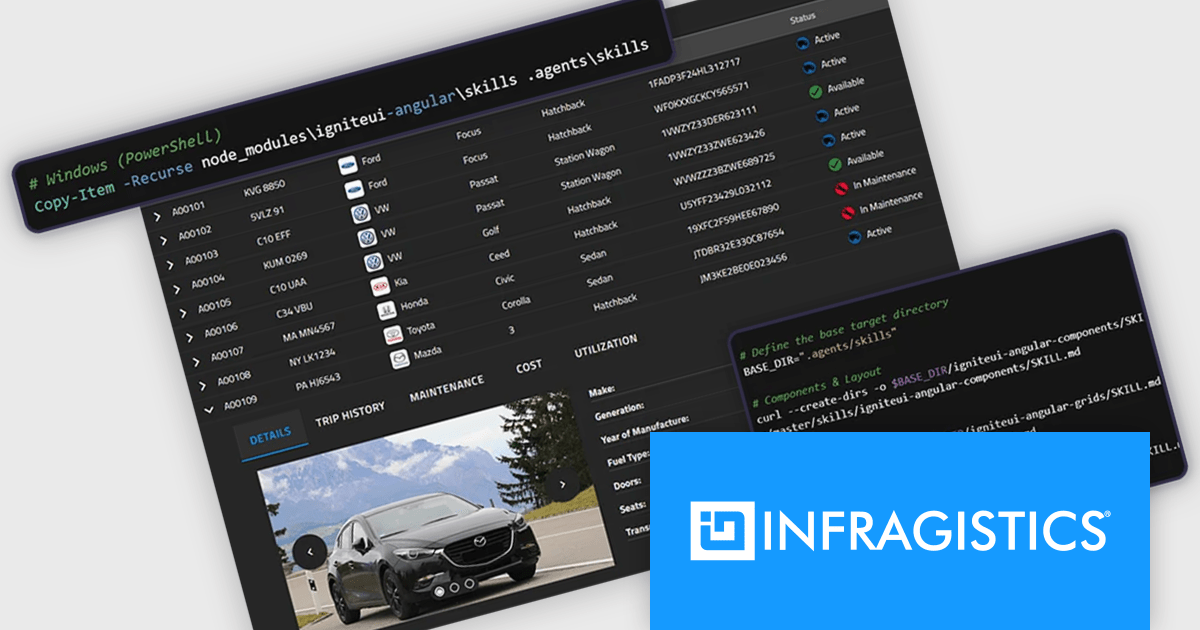
The Infragistics Ultimate 26.1 release includes an AI-Assisted Development Toolchain which helps ensure AI coding assistants generate applications using the correct Ignite UI components, APIs, import paths, and design tokens, reducing the risk of inaccurate code suggestions. Designed to keep AI-generated development aligned with established design systems and component libraries, the toolchain is available as three independently usable layers. All three layers now support Angular, React, Web Components, and Blazor, giving development teams greater flexibility when incorporating AI-assisted workflows into modern application projects.
To see a full list of what's new in version 26.1, see our release notes.
Infragistics Ultimate is licensed per developer and is available as a Perpetual License with a 1, 2 or 3 year support and maintenance subscription. See our Infragistics Ultimate licensing page for full details.
For more information, visit our Infragistics Ultimate product page.
Document Solutions for Excel by MESCIUS is designed to enable developers to create and manipulate Microsoft Excel documents programmatically. It provides a robust API for interacting with Excel spreadsheets, allowing developers to automate tasks such as data extraction, formatting, and generation of reports. The framework offers comprehensive support for various Excel features, including formulas, charts, conditional formatting, and data validation. It also provides tools for handling large datasets and optimizing performance, making it suitable for both small-scale and enterprise-level applications.
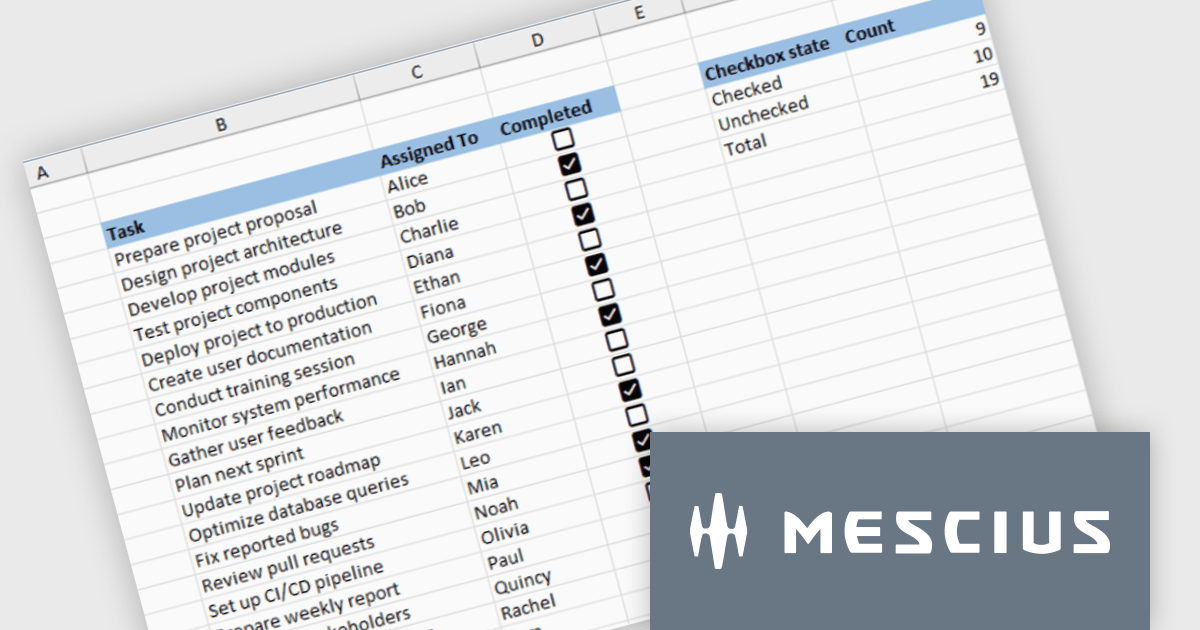
Document Solutions for Excel enables developers to add interactive checkboxes directly within worksheet cells, ensuring they remain synchronized with the underlying data during sorting, filtering, and row operations. By embedding checkbox controls into cells rather than using separate form elements, developers can create more reliable Excel style checklist experiences with less complexity, while maintaining compatibility across exports and supported file formats.
Document Solutions for Excel is licensed per developer and is available in several license options for differing distribution needs. Team licenses are also available for multiple developers within the same organization. See our Document Solutions for Excel, .NET Edition licensing page for full details.
Document Solutions for Excel Editions are available to buy in the following products:


Tel.: (888) 850 9911
Fax: +1 770 250 6199


