


Offizieller Lieferant
Als offizieller und autorisierter Distributor beliefern wir Sie mit legitimen Lizenzen direkt von mehr als 200 Softwareherstellern.
Sehen Sie alle unsere Marken.
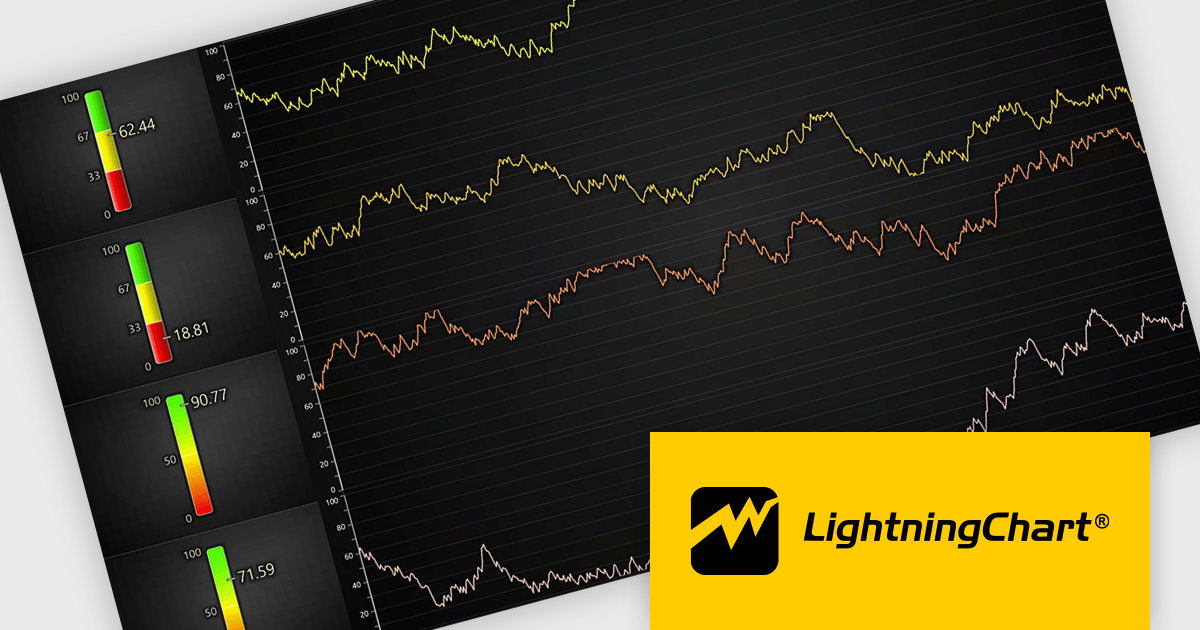
LightningChart JS is a high-performance JavaScript charting library that utilizes WebGL rendering and GPU acceleration to deliver exceptional performance for a wide range of data visualization needs. It is designed to handle large datasets and complex visualizations with ease, enabling developers to create interactive and visually appealing 2D and 3D charts. Ideal for applications demanding smooth real-time data updates, such as financial platforms, engineering tools, scientific research dashboards, and industrial monitoring systems, LightningChart JS provides a comprehensive API for customization and integration into web-based projects.
The LightningChart JS v8.2 update introduces a new Linear Gauge Chart that enables software developers to present real-time metrics in a clear, structured format within modern web applications. It supports continuous live data updates, configurable interpolated or discrete color steps for representing thresholds and ranges, and both vertical and horizontal orientations to accommodate different layout requirements. The chart also allows current values to be displayed directly on the gauge and supports custom icons, giving developers greater control over visual consistency while building intuitive, status-focused dashboards for monitoring and analytics use cases.
To see a full list of what's new in v8.2, see our release notes.
LightningChart JS is licensed per developer and is available as an annual license with 1 year support. See our LightningChart JS licensing page for full details.
For more information, see our LightningChart JS product page.

ComponentSource and SurveyJS have spent the past year working together to bring form building and survey automation tools to developers and organisations worldwide. SurveyJS is known for its flexible, client side JavaScript components that make it easy to create, customise, and manage forms and surveys across modern web applications, with support for frameworks such as Angular, React, and Vue. Built around a JSON based architecture, SurveyJS enables teams to integrate advanced form functionality into existing systems without backend restrictions or long term maintenance overhead.
At the heart of the SurveyJS product lineup is SurveyJS Creator, the flagship visual form builder available through ComponentSource. This highly configurable tool allows users to design complex forms and surveys through an intuitive interface, while retaining full control over appearance, behaviour, and data structure to meet precise project requirements.
Through this partnership, ComponentSource strengthens its portfolio of developer focused tools by offering a proven, highly customisable form solution that complements its wider range of UI and application development products. By working closely with SurveyJS, ComponentSource helps deliver these solutions to a global audience, providing licensing, support, and reach that enable the SurveyJS brand to scale internationally while giving customers access to trusted, best in class technology.
Learn more about SurveyJS.
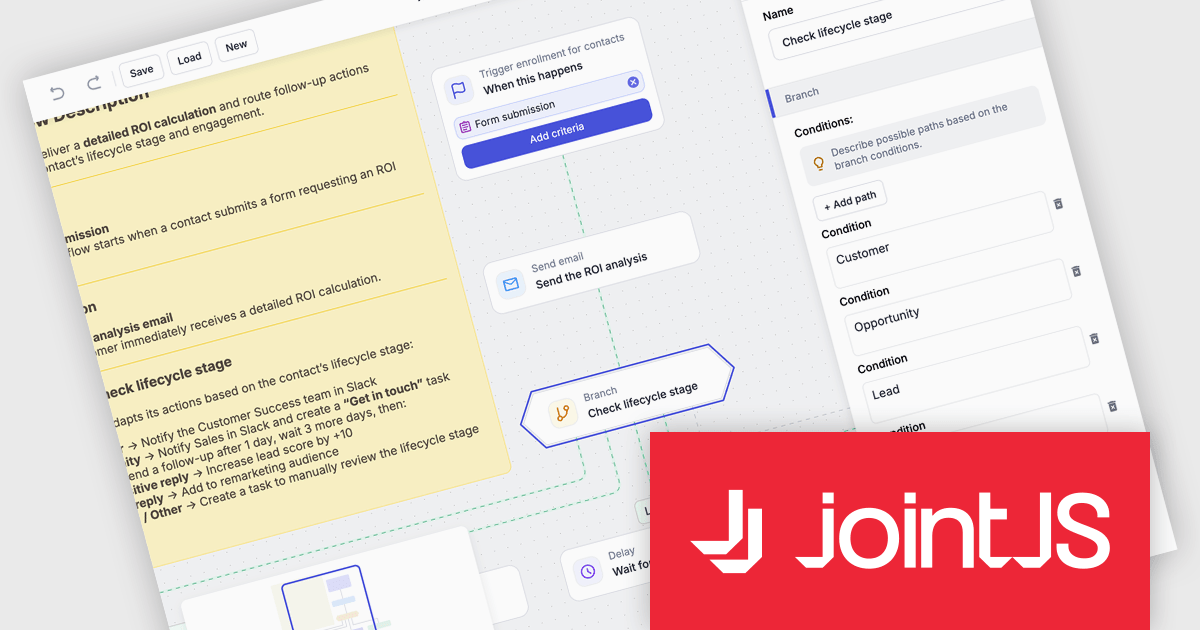
JointJS+ is a diagramming library that offers advanced features like custom shapes, data binding, and advanced layout algorithms, enabling you to create complex, interactive, and visually appealing diagrams. It includes a ready-to-use demo application that showcases its functionality and serves as a starting point for your own diagramming projects.
The JointJS+ v4.2.2 update introduces a new Marketing Automation application template that enables developers to efficiently design, visualize, and manage marketing automation workflows through an interactive, fully animated diagram with automatic layout and orthogonal link routing. By eliminating the need for manual positioning and providing smooth transitions between states, the template improves diagram clarity and maintainability while allowing developers to simulate workflows using the built-in test flow functionality to validate logic, identify issues early, and iterate with greater confidence.
To see a full list of what's new in v4.2.2, see our release notes.
JointJS+ is licensed per developer and is available as a Perpetual license with 1 year support and maintenance. See our JointJS+ licensing page for full details.
Learn more on our JointJS+ product page.
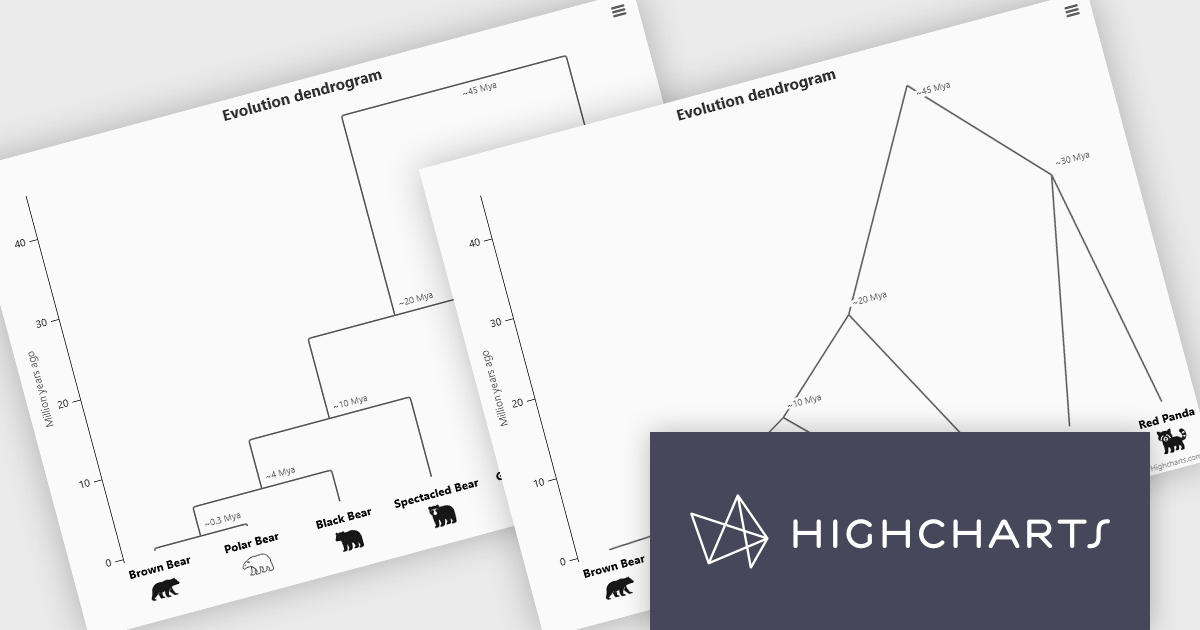
Highcharts is a JavaScript charting framework that allows web developers and data analysts to generate dynamic, visually appealing charts and graphs for websites and web applications. It can display a variety of chart types, including line, spline, area, column, bar, pie, scatter, and many more. Highcharts is well-known for its ease of use, rich documentation, and ability to handle huge datasets efficiently. Features include responsive design, accessibility support, and cross-browser compatibility. Its customization capabilities allow users to create bespoke data visualizations that increase engagement and provide insightful data presentations.
The Highcharts 12.5 update introduces dendrogram support, allowing developers to visualize hierarchical relationships and similarity levels directly within their charts using treegraph-based diagrams. This enhancement makes it easier to represent the output of hierarchical clustering algorithms, taxonomies, and other structured datasets in a clear and interpretable way. By mapping similarity or progression along an axis and using branch height to indicate relationships, developers can present complex hierarchical data more effectively.
To see a full list of what's new in 12.5, see our release notes.
Highcharts Core is licensed on an annual or perpetual basis, OEM licenses, and Advantage Renewals. It is licensed per Developer and has several license options including Internal, SaaS, SaaS+, and Self Hosted. See our Highcharts Core licensing page for full details.
Learn more on our Highcharts Core product page.

Froala Editor is a lightweight, modern WYSIWYG (What You See Is What You Get) rich text editor designed for web applications, offering a clean interface, fast performance, and extensive customization options. Built with a focus on usability and developer flexibility, it provides a wide range of formatting tools, media management capabilities, and advanced features such as inline editing, collaborative functionality, and mobile responsiveness. Its modular architecture, robust API, and broad framework integrations make it suitable for embedding into enterprise-level platforms as well as smaller applications requiring a polished content-editing experience.
The Froala v5.0.0 update introduces support for importing content directly from Microsoft Word documents. This allows users to bring in Word-authored content while keeping the original formatting, styles, and structure intact. The update removes the need for custom cleanup scripts, helping produce more reliable and consistent HTML during content transfers.
To see a full list of what's new in v5.0.0, see our release notes.
Froala Editor is licensed per product and domain. It is available as an annual or perpetual license with version upgrades and support. See our Froala Editor licensing page for full details.
For more information, visit our Froala Editor product page.


Tel.: (888) 850 9911
Fax: +1 770 250 6199


