


Offizieller Lieferant
Als offizieller und autorisierter Distributor beliefern wir Sie mit legitimen Lizenzen direkt von mehr als 200 Softwareherstellern.
Sehen Sie alle unsere Marken.
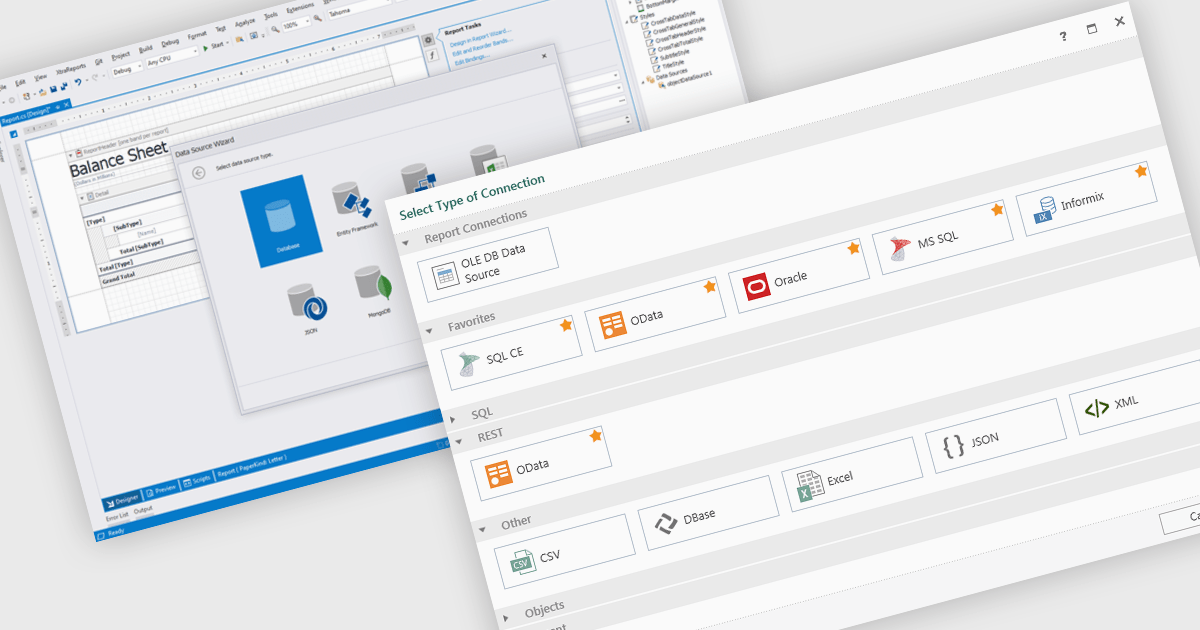
Data connectivity is a foundational aspect of modern reporting components, enabling applications to retrieve and present data from a wide variety of sources. Whether integrating with relational databases, cloud services, or flat files, effective data connectivity ensures that reports reflect current, accurate information. Reporting components are designed to abstract the complexity of accessing these data sources, providing developers with flexible APIs and tools to bind data into visualizations and formatted reports.
Common features include:
For an in-depth analysis of features and price, visit our Blazor reporting components comparison.
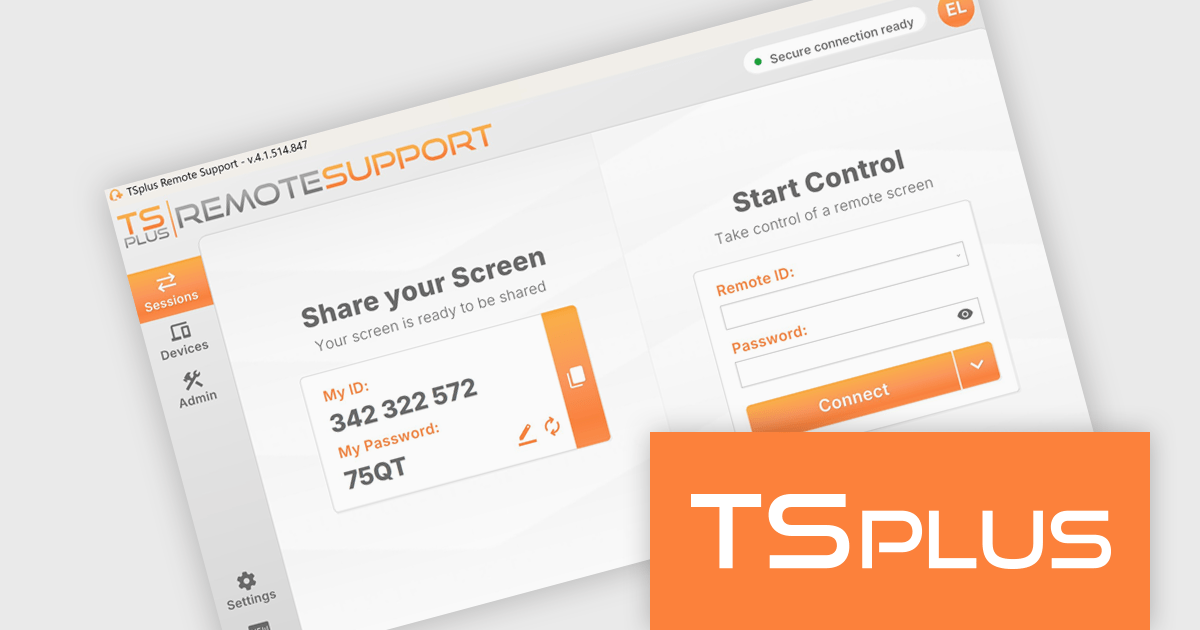
TSplus Remote Support is a remote desktop control solution that enables IT teams to deliver instant attended or unattended assistance without complex setup. Agents can take control of a user’s screen, mouse, and keyboard with a single click and communicate via built-in chat. The platform supports live troubleshooting, background maintenance, branded client customization, and secure connection management through TSplus servers. Typical use cases include help desk support, unattended system updates, and remote training, all achieved through a user-friendly, scalable interface.
TSplus Remote Support offers a robust screen sharing feature that enables support agents to seamlessly take control of a client's screen, mouse, and keyboard with a single click from the end-user. This immediate access is facilitated through a lightweight executable, requiring no installation or configuration, improving the support process. Once connected, a dedicated chat interface appears, allowing for real-time communication and file sharing between the agent and the client. The platform supports both attended and unattended sessions, providing flexibility for various support scenarios.
TSplus Remote Support is licensed per concurrent connection. Licenses include a 1 year subscription for updates and support. See our TSplus Remote Support licensing page for full details.
For more information, visit our TSplus Remote Support product page.
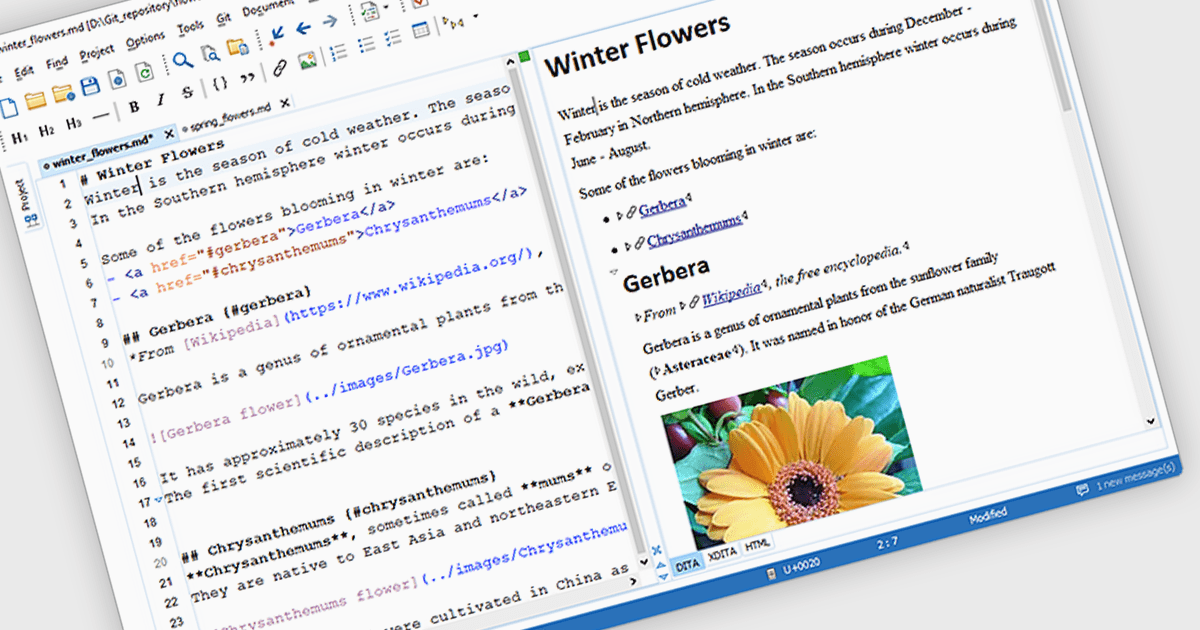
Output Preview in a Structured Document Tool is a feature that allows developers to view a rendered representation of the final document output based on the current structure, formatting rules, and data bindings. This capability is essential for verifying that layout configurations, styling, and dynamic content integration are functioning as expected before the document is finalized or exported. It helps catch formatting issues, data mismatches, or layout problems early in the development process, improving the accuracy and efficiency of document design workflows. For developers, this ensures that the output aligns with business or user requirements without repeatedly exporting or compiling the document.
Several Structured Document Tools offer output preview including:
For an in-depth analysis of features and price, visit our comparison of Structured Document Tools.
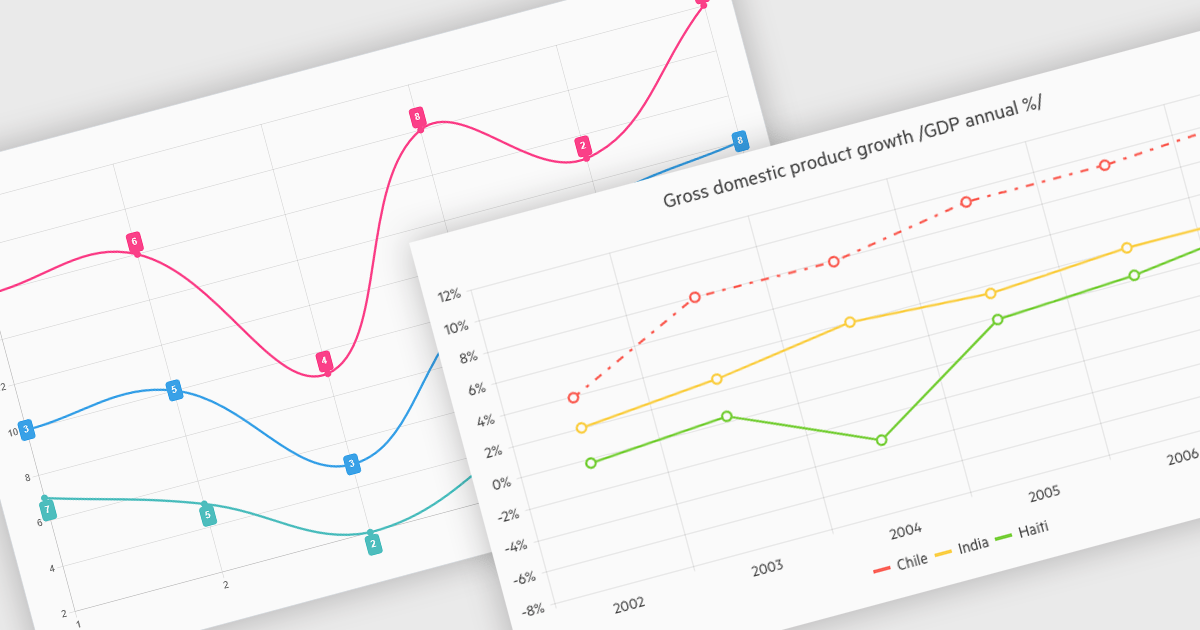
Line charts connect data points with lines to show how values change over a continuous scale, usually time. They make it easy to reveal long-term trends, seasonal patterns and sudden shifts while comparing multiple series on the same axes. Common applications include tracking stock prices, monitoring website traffic, analyzing climate data and comparing regional sales to guide business strategy. By highlighting progression and anomalies without clutter, line charts help turn raw numbers into clear, actionable insights.
Several .NET Blazor Chart Controls offer support for line charts including:
For an in-depth analysis of features and price, visit our comparison of .NET Blazor Chart Controls.
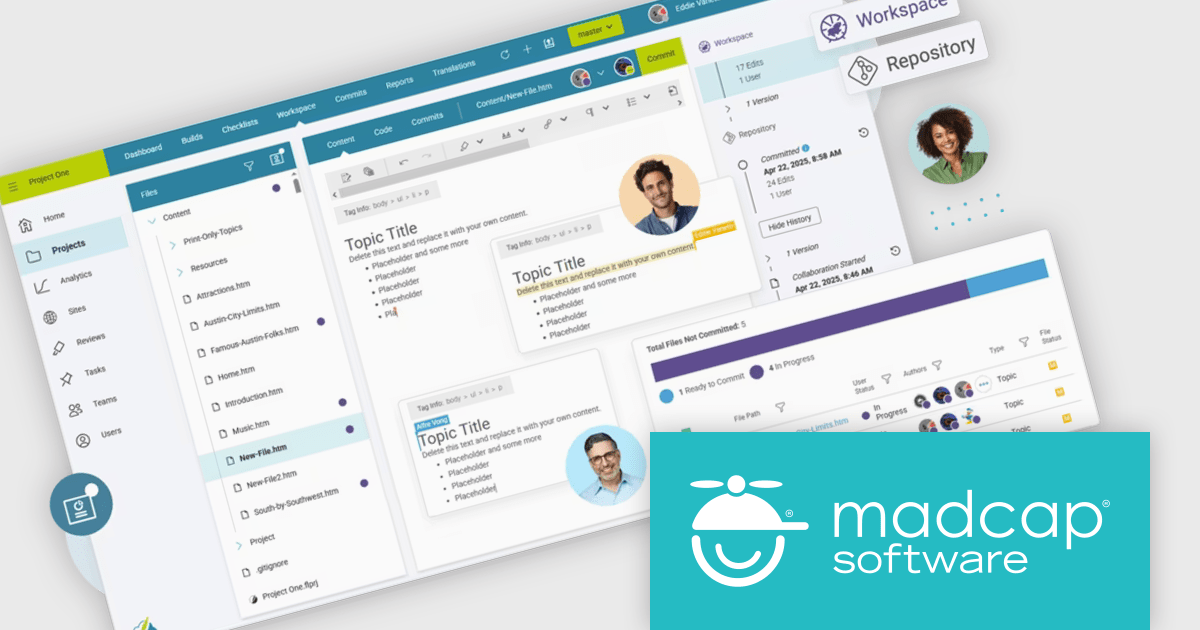
MadCap Flare Online is a cloud-based authoring platform that streamlines the creation, delivery, and management of technical content. Organizations can publish and host documentation, knowledge bases, and user guides directly to the web without managing complex infrastructure. Designed for collaboration and scalability, Flare Online enables teams to maintain a consistent brand experience across all outputs while providing end users with an intuitive, self-service interface.
Flare Online provides a real-time browser editor with built-in Git source control, allowing multiple writers to coauthor, track versions, and roll back changes seamlessly. Its responsive design features and search optimization ensure that content looks great and is easy to find on any device. AI-assisted writing tools help enforce style consistency and reduce manual editing, while single-source publishing delivers coordinated outputs to HTML5, desktop, and print formats. Integrated task management and automated build scheduling keep projects on track, and analytics integration provides insights into user engagement for continuous improvement. With automated translation workflows and out-of-the-box integrations with Salesforce, Zendesk, ServiceNow, and Slack, Flare Online supports large-scale documentation initiatives and accelerates time to market.
MadCap Flare Online is licensed per user (Author) on a 12 month basis. A Platform license is required in addition to any user (Author) licenses. See our MadCap Flare Online licensing page for full details.
For more information, see our MadCap Flare Online product page.


Tel.: (888) 850 9911
Fax: +1 770 250 6199


