








Offizieller Lieferant
Als offizieller und autorisierter Distributor beliefern wir Sie mit legitimen Lizenzen direkt von mehr als 200 Softwareherstellern.
Sehen Sie alle unsere Marken.
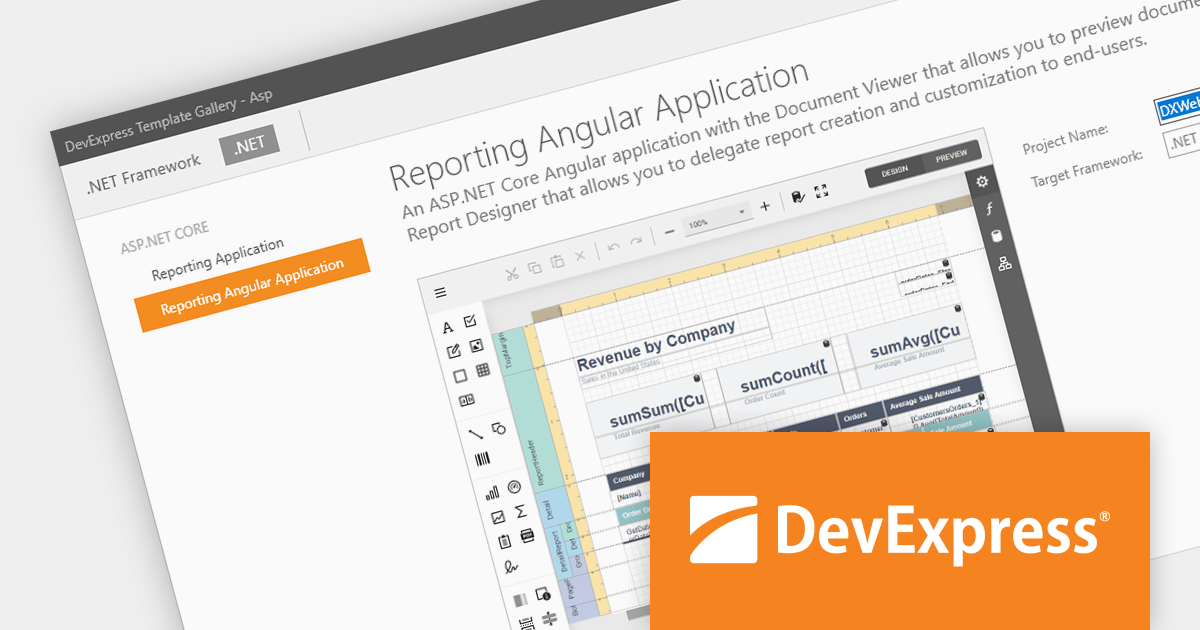
DevExpress Reporting is a powerful, versatile tool for building reports in the .NET ecosystem. It lets you design professional-looking reports with a visual editor, connect to various data sources, and customize them with charts, graphs, and interactive elements. Whether you're creating invoices, sales summaries, or complex dashboards, DevExpress Reporting offers the flexibility and features to bring your data to life in a clear and insightful way. It integrates seamlessly with WinForms, WPF, Web, and Blazor applications, making it a popular choice for developers who need a robust reporting solution.
The DevExpress Reporting 23.2 release introduces a native Angular Report Viewer. This new component seamlessly integrates into your Angular applications, eliminating the need for Knockout.js. Built for performance, it leverages native platform rendering for lightning-fast document visualization. Property management is simplified, replacing observable complexities with a straightforward event-based mechanism. To optimize development, you can now utilize native Angular components as templates for report viewer elements. Embrace a streamlined, efficient, and Knockout-free reporting experience with the Native Angular Report Viewer.
To see a full list of what's new in version 23.2, see our release notes.
DevExpress Reporting is licensed per developer and is available as a Perpetual License with a 12 month support and maintenance subscription. See our DevExpress Reporting licensing page for full details.
DevExpress Reporting is available to buy in the following products:
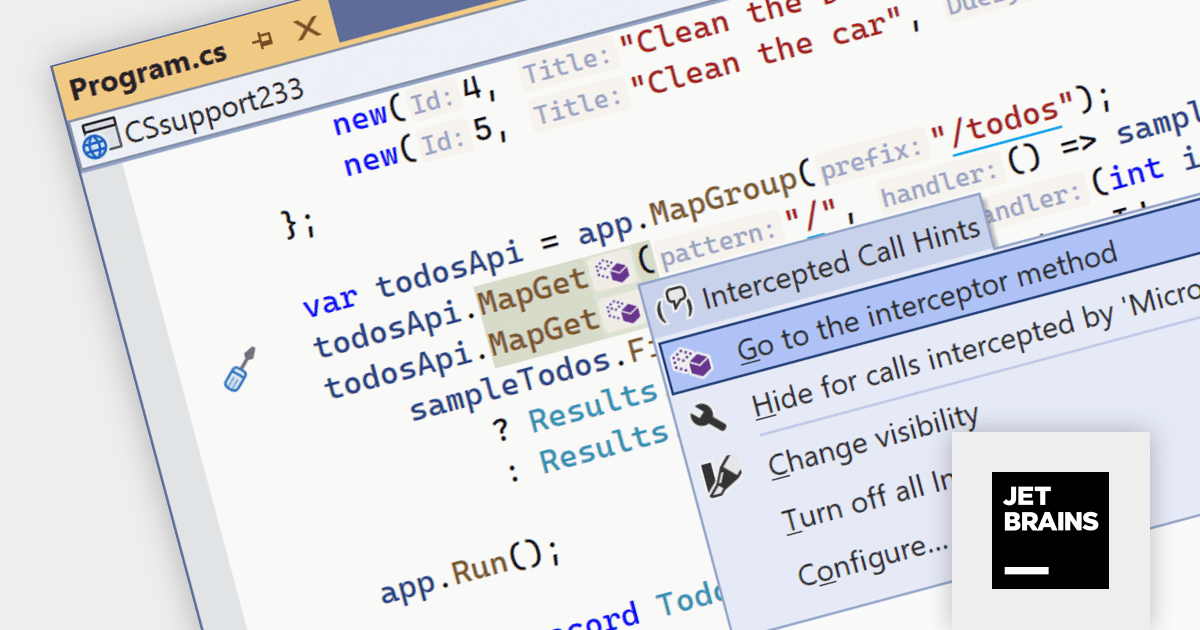
ReSharper is an intelligent add-in for Visual Studio. It comes equipped with a rich set of features including intelligent coding assistance, on-the-fly error highlighting and quick error correction. ReSharper also supports code refactoring, unit testing, navigation and search.
The ReSharper 2023.3 release improves C# 12 features with support for primary constructors, alias directives to reference any kind of type, collection expressions and interceptors. Eliminate repetitive field declarations and assignments by directly using primary constructor parameters within members. Constructor logic becomes more streamlined and focused, enhancing code clarity and maintainability. Easily transform existing classes and structs to leverage primary constructors, guided by ReSharper's refactoring capabilities.
To see a full list of what's new in version 2023.3, see our release notes.
ReSharper is licensed per user, and is available as a commercial annual subscription license. We can supply new subscriptions, subscription renewals (including continuity discounts), lapsed renewals, and additional user licenses. See our ReSharper licensing page for full details.
For more information, visit our ReSharper product page.
DevExpress WPF is a powerful suite of controls that enhances your WPF development toolkit. It offers data grids, ribbon menus, rich text editors, spreadsheets, charts, and more – all with beautiful themes and touch-friendly interfaces. DevExpress WPF empowers you to build professional-looking, responsive applications that meet modern user expectations, saving you time and effort while adding polish and functionality.
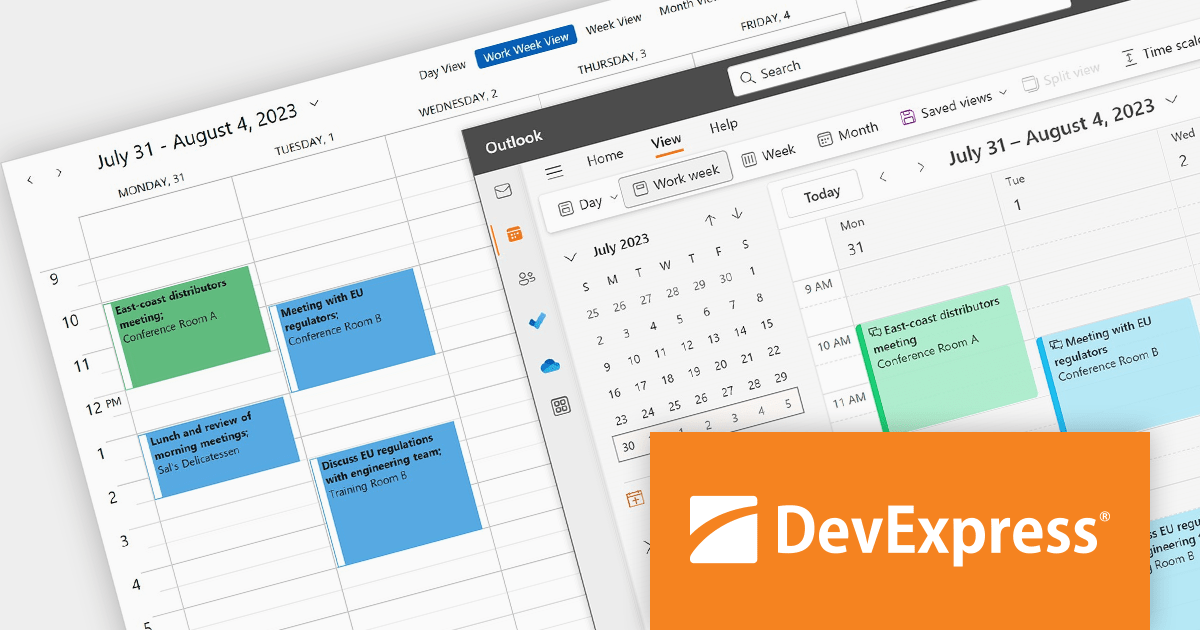
The DevExpress WPF 23.2 update helps you stay organized and on top of your schedule. The WPF Scheduler component now seamlessly connects with Microsoft 365 (Outlook) Calendars. Effortlessly export appointments, import events, and even merge calendars and resolve conflicts with ease.
To see a full list of what's new in version 23.2, see our release notes.
DevExpress WPF is licensed per developer and is available as a Perpetual License with a 12 month support and maintenance subscription. We can supply new subscriptions, subscription renewals, and additional licenses. See our DevExpress WPF licensing page for full details.
DevExpress WPF is available to buy in the following products:
Infragistics App Builder is a cloud-based tool that helps designers and developers build modern web apps faster. It acts as a bridge between design and code, letting you drag-and-drop UI components and generate production-ready Angular or Blazor code instantly. This eliminates the need for hand-coding layouts and saves time, allowing you to iterate on designs quickly and get feedback sooner. App Builder is a visual development platform that includes a toolbox of 60+ UI controls to turn your ideas into pixel-perfect apps without the coding headache.
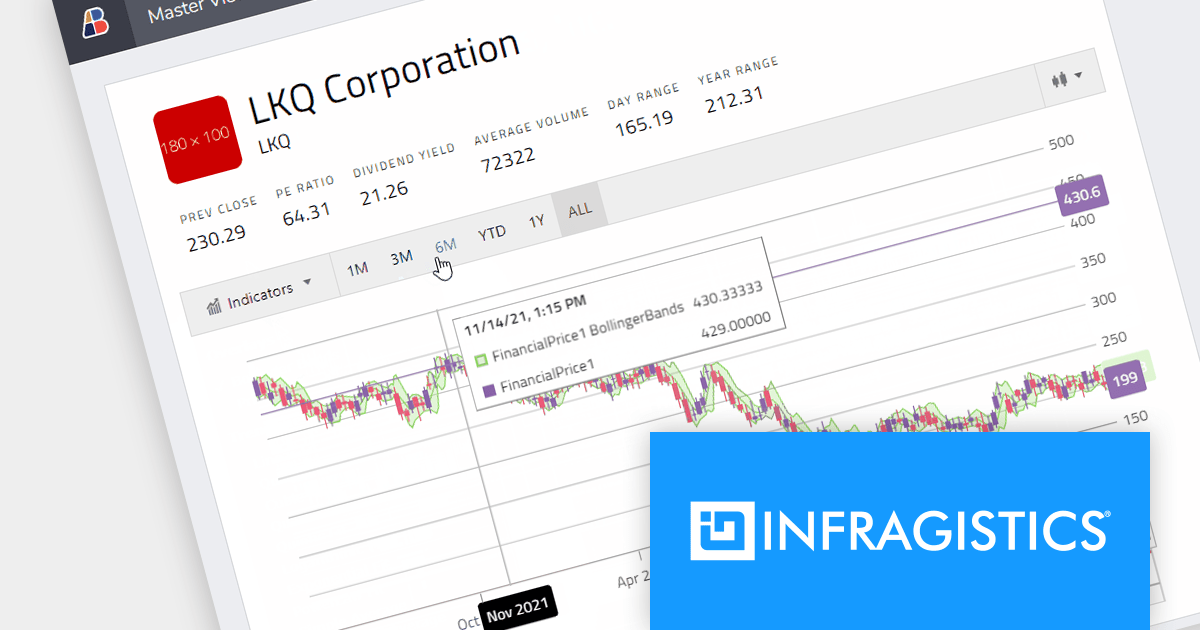
The December 2023 release adds a new financial chart component to the App Builder Toolbox. This comprehensive visualization tool presents stock ticker data or price data in a dynamic time-series display. The Financial Chart illustrates the progression of stock prices for a specific ticker over time, plotted on a Time Series X-Axis. Additionally, it provides details such as the open, high, low, and close prices (OHLC) of a company's ticker data, which can be adjusted for different time periods.
This new component unleashes the power of market visualization, transforming raw data into captivating stories. Users can track stock prices over time, compare multiple tickers, and dissect key metrics, all within an interactive interface. This empowers users to gain deeper insights, make informed decisions, and even learn the language of the market, making your app an invaluable tool for investors, analysts, and anyone curious about the financial world.
To see a full list of what's new in the December 2023 release, see our release notes.
Infragistics App Builder is licensed per user as an annual subscription. It is available as Cloud and On Premise solutions. See our Infragistics App Builder licensing page for full details.
For more information, visit our Infragistics App Builder product page.

Financial apps can be significantly enriched by integrating open-high-low-close charts. These versatile visualizations condense price movement data into clear, concise bars, empowering users to rapidly grasp market trends and identify potential trading opportunities. With a quick glance, users can assess open, high, low, and closing prices within a chosen timeframe, gaining valuable insights into market sentiment and volatility. This immediate understanding fosters informed decision-making, transforming your Vue.js app into a dynamic platform for financial analysis and informed action.
Several Vue.js chart controls offer OHLC charts including:
For an in-depth analysis of features and price, visit our Vue.js chart controls comparison.





Tel.: (888) 850 9911
Fax: +1 770 250 6199


