








Offizieller Lieferant
Als offizieller und autorisierter Distributor beliefern wir Sie mit legitimen Lizenzen direkt von mehr als 200 Softwareherstellern.
Sehen Sie alle unsere Marken.
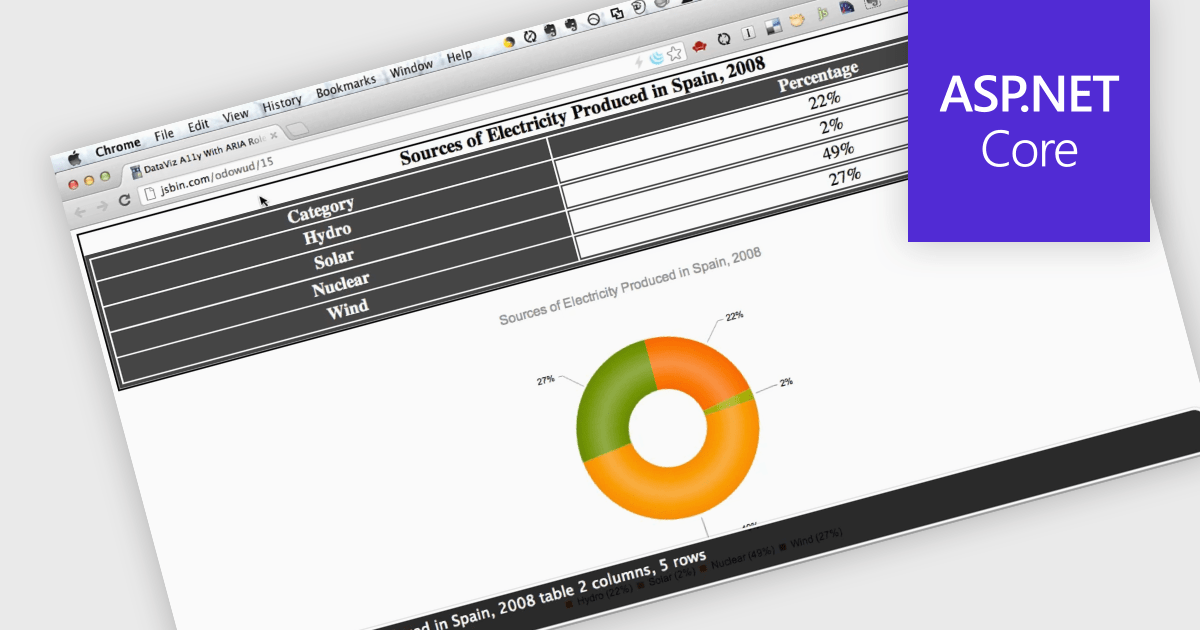
Screen readers, in the context of charts, are assistive technologies that convert digital text and interface elements into speech or braille, allowing users with visual impairments to navigate and understand graphical data on the screen. This involves adding semantic structure, descriptive labels, and metadata so the chart's content can be understood through auditory feedback, enabling users with visual impairments to understand trends, values, and relationships within the chart without needing to see the visual representation. Proper implementation not only improves usability, particularly in data driven environments, but also supports compliance with established accessibility standards such as WCAG (Web Content Accessibility Guidelines).
Several ASP.NET Core charting components support the use of screen readers, such as:
For an in-depth analysis of features and price, visit our comparison of ASP.NET Core chart components.
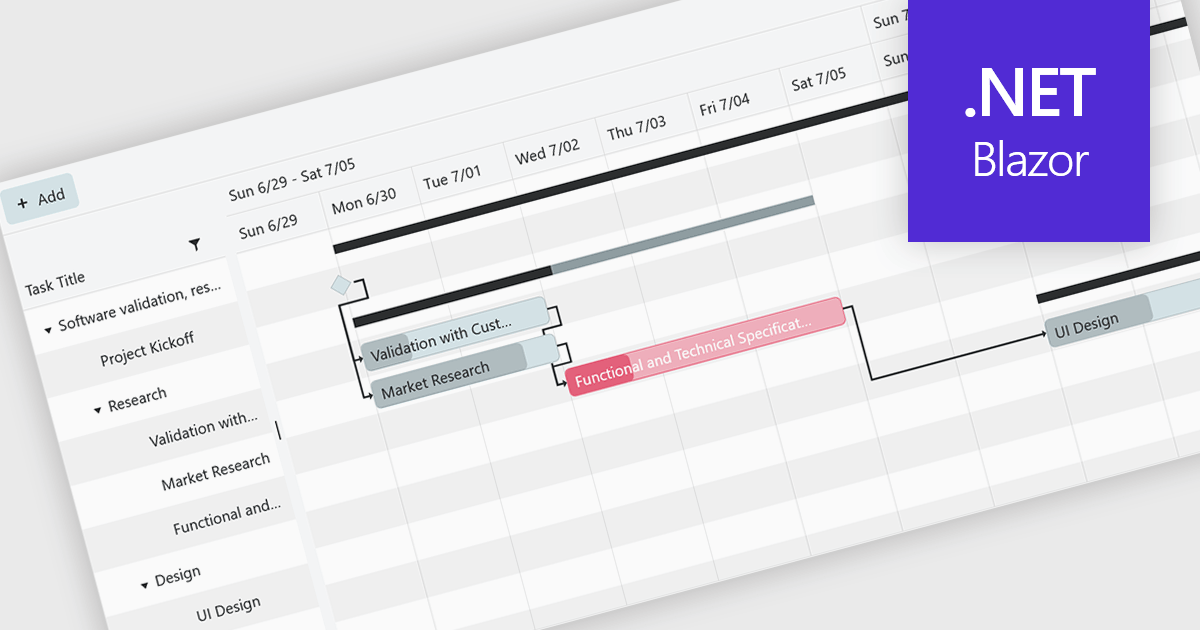
Gantt controls are invaluable tools for project management, particularly in visualizing and tracking the timeline of tasks, dependencies, and progress. These controls are ideal for illustrating project schedules, resource allocation, and critical paths. By providing a clear and concise overview of project milestones, Gantt controls facilitate effective planning, communication, and monitoring, ultimately helping organizations achieve project goals efficiently and on time.
Several .NET Blazor UI suites offer Gantt controls including:
For an in-depth analysis of features and price, visit our .NET Blazor UI suites comparison.
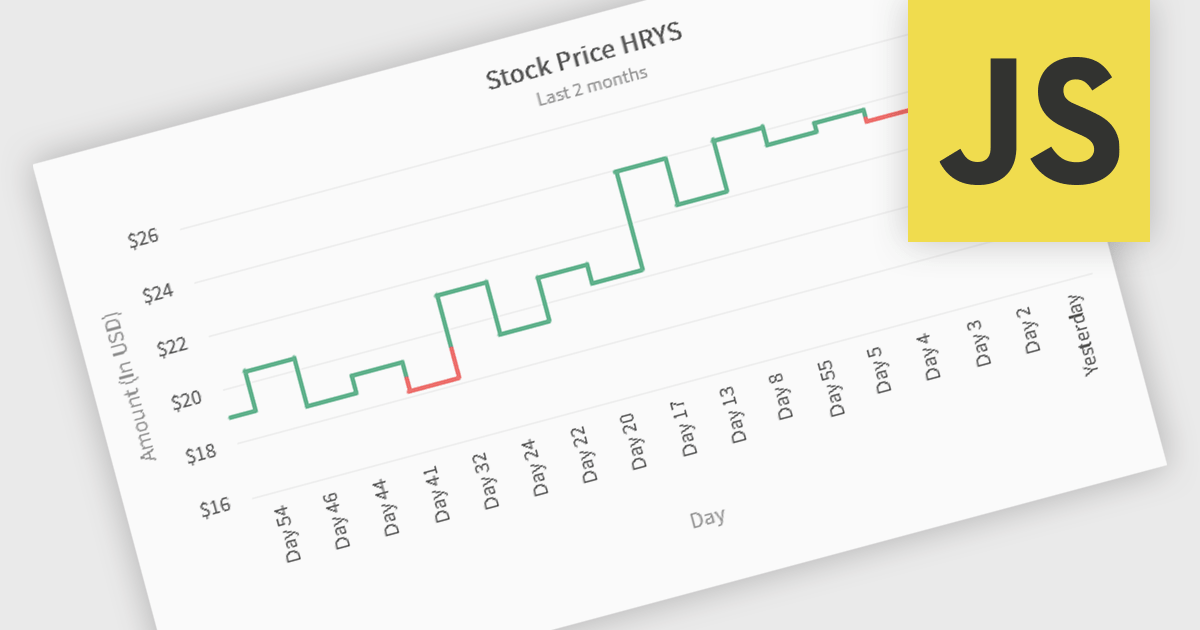
Kagi charts are a technical analysis tool that display price movement through vertical lines, ignoring time to focus on significant price changes. Thick lines indicate rising demand when prices break above previous highs, while thin lines signal increased supply when prices fall below previous lows. This clear visual format helps traders filter out noise, identify trends, and spot key breakouts or reversals. Ideal for analyzing market sentiment, Kagi charts are used across stocks, forex, and commodities to support confident, data-driven trading decisions.
Several JavaScript chart components provide Kagi charts, including:
For an in-depth analysis of features and price, visit our JavaScript charts comparison.
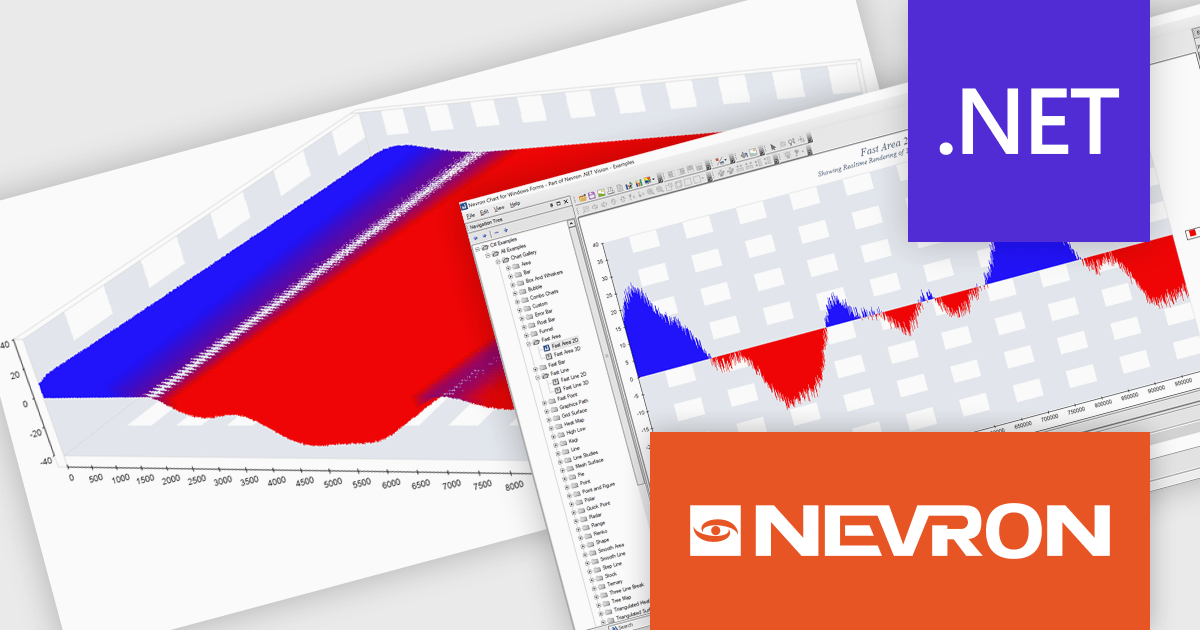
Nevron Chart for .NET is an advanced component suite designed for developers to add rich charting functionality to WinForms, WPF, ASP.NET and MVC applications. Covering any data visualization requirements it is an ideal solution for developing charting enabled presentation, business, scientific or financial applications. It boasts hardware acceleration for optimal performance, a flexible API for customization, and advanced interactivity features like zooming, panning, and tooltips to enhance user engagement with your data.
The Nevron Chart for .NET 2025.1 update introduces the new 'NFastAreaSeries', enabling real-time rendering of millions of data points using GPU acceleration. This addition significantly enhances performance for area charts, making it well-suited for high-volume data visualization scenarios. It complements existing fast-rendering series and includes optimizations that improve rendering efficiency across both imperial and metric units. Combined with automatic culture-based unit selection, the update ensures a responsive and localized user experience for developers building advanced data visualization applications.
To see a full list of what's new in 2025.1, see our release notes.
Nevron Chart for .NET is licensed per developer machine and is available as a perpetual license with 1 year subscription and support. See our Nevron Chart for .NET licensing page for full details.
Nevron Chart for .NET is available to buy in the following products:
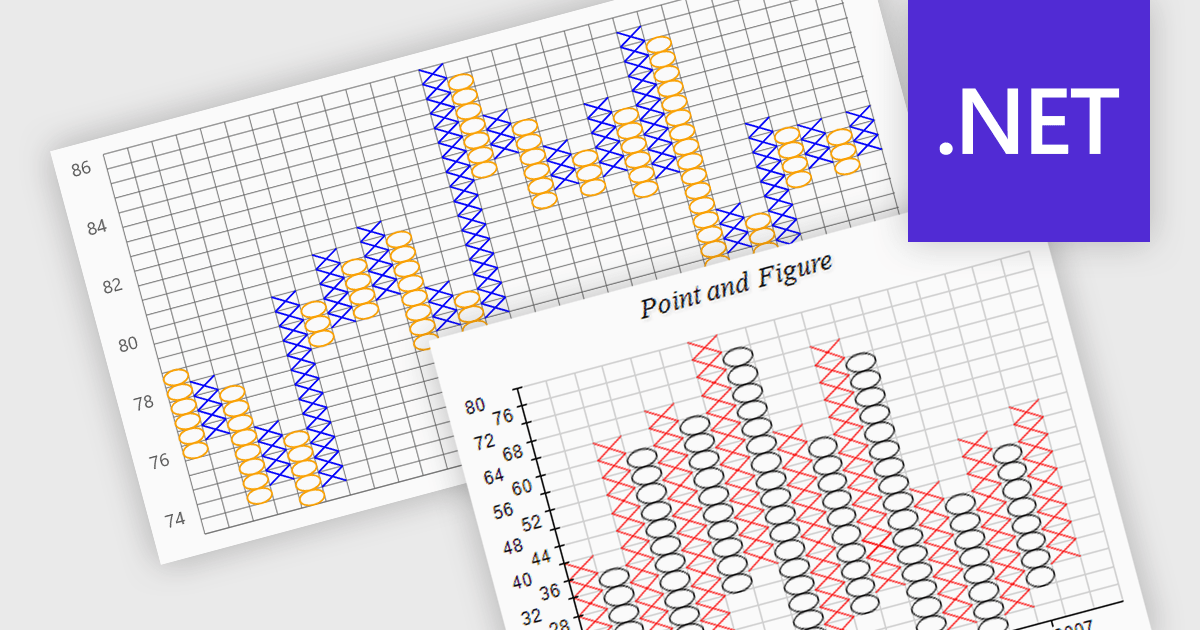
A point and figure (P&F) chart is a financial charting technique used to track price movements by plotting directional changes in price without reference to time. It focuses exclusively on significant price changes, filtering out minor fluctuations to highlight clear trends and reversals. Instead of plotting prices continuously, it uses columns of Xs and Os to represent rising and falling prices, respectively, based on predefined price increments. This chart type provides a straightforward view of supply and demand dynamics, making it particularly effective for identifying support and resistance levels, breakout patterns, and trend direction. Its simplicity helps traders and analysts focus on essential price action, reducing the noise found in traditional time-based charts.
Several .NET charting components provide you with point and figure charts, including:
For an in-depth analysis of features and price, visit our comparison of .NET chart components.





Tel.: (888) 850 9911
Fax: +1 770 250 6199


