


Offizieller Lieferant
Als offizieller und autorisierter Distributor beliefern wir Sie mit legitimen Lizenzen direkt von mehr als 200 Softwareherstellern.
Sehen Sie alle unsere Marken.
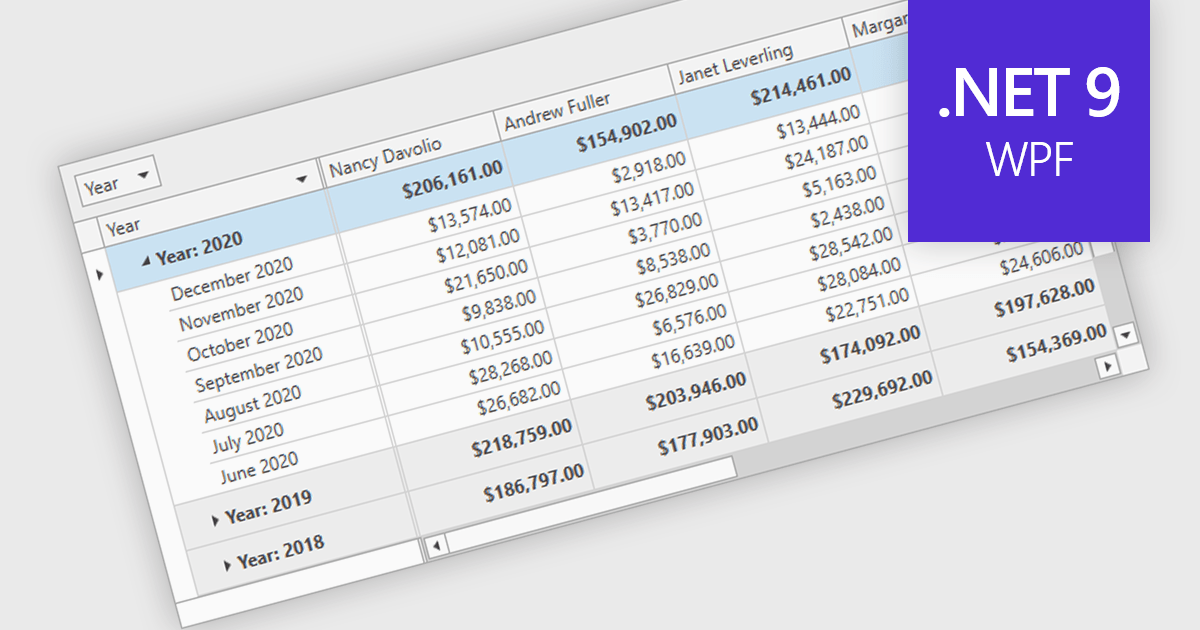
Group summary functionality enables grid components to aggregate and display key metrics such as sums, averages, and counts at the group level, offering a clear snapshot of grouped data. This feature streamlines data presentation by embedding calculated summaries directly within each group, eliminating the need for external tools or manual computations. By summarizing large datasets in real time, it improves readability, boosts decision-making efficiency, and optimizes performance through advanced data processing techniques.
Several .NET 9 WPF grid controls offer group summary functionality including:
For an in-depth analysis of features and price, visit our comparison of .NET 9 WPF Grid Controls.
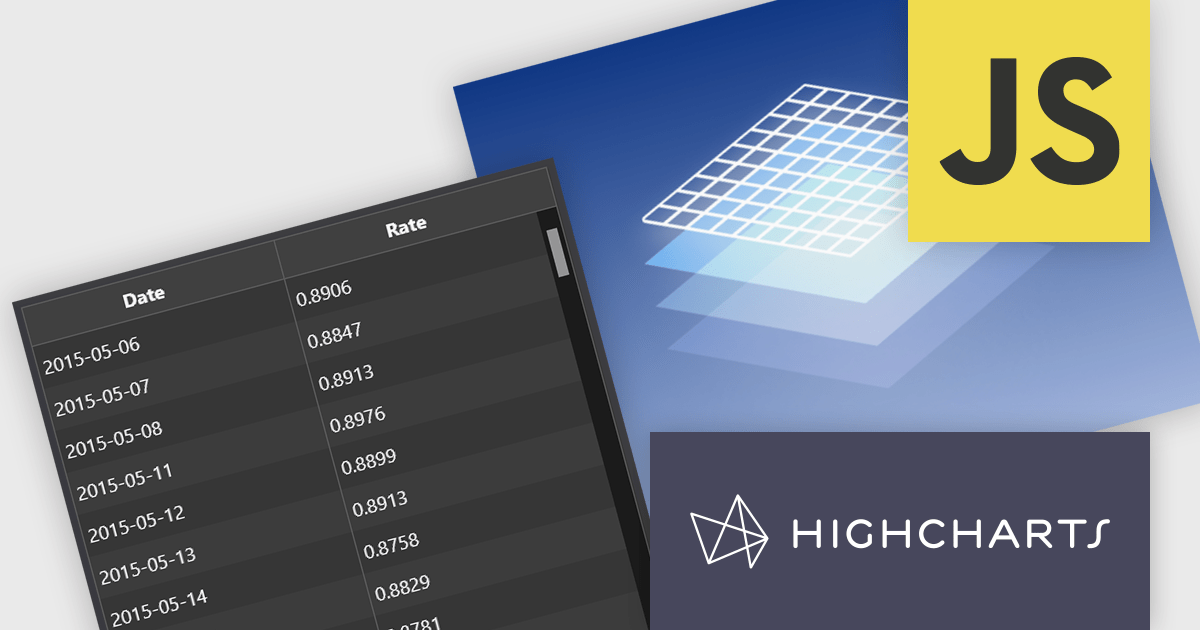
Highsoft is a Norwegian software publisher best known for Highcharts Core, a widely used JavaScript library for interactive data visualization. It specializes in developing powerful, flexible, and accessible charting solutions for developers, businesses, and data analysts. Highcharts is recognized for its seamless integration, extensive customization options, and support for a broad range of chart types, making it a popular choice for web applications and enterprise dashboards. Expanding its data visualization portfolio, Highsoft also offers Highcharts Dashboards, Highcharts Gantt, Highcharts Maps, and Highcharts Stock, catering to diverse analytical and reporting needs.
Highsoft has announced Highcharts Grid Lite, a forthcoming free solution that brings the core functionality of the data grid component in Highcharts Dashboards to a standalone, lightweight package. Designed for seamless integration into modern web applications, it offers high performance while remaining accessible and efficient. It supports WCAG-compliant interactions, ensuring usability across different environments. Its optimized row virtualization enables smooth handling of large datasets without performance degradation. Developers can easily integrate it with frameworks like React, Vue, and Angular while leveraging its intuitive API for streamlined data management and customization. With built-in CSS theming, it allows for flexible styling to match application requirements, making it a reliable solution for creating responsive, interactive tables.
Read the Highcharts Grid Lite blog post for more details on this advanced solution for building responsive, interactive data grids.
To explore the Highsoft product range, including Highcharts Dashboards, visit our Highsoft brand page.
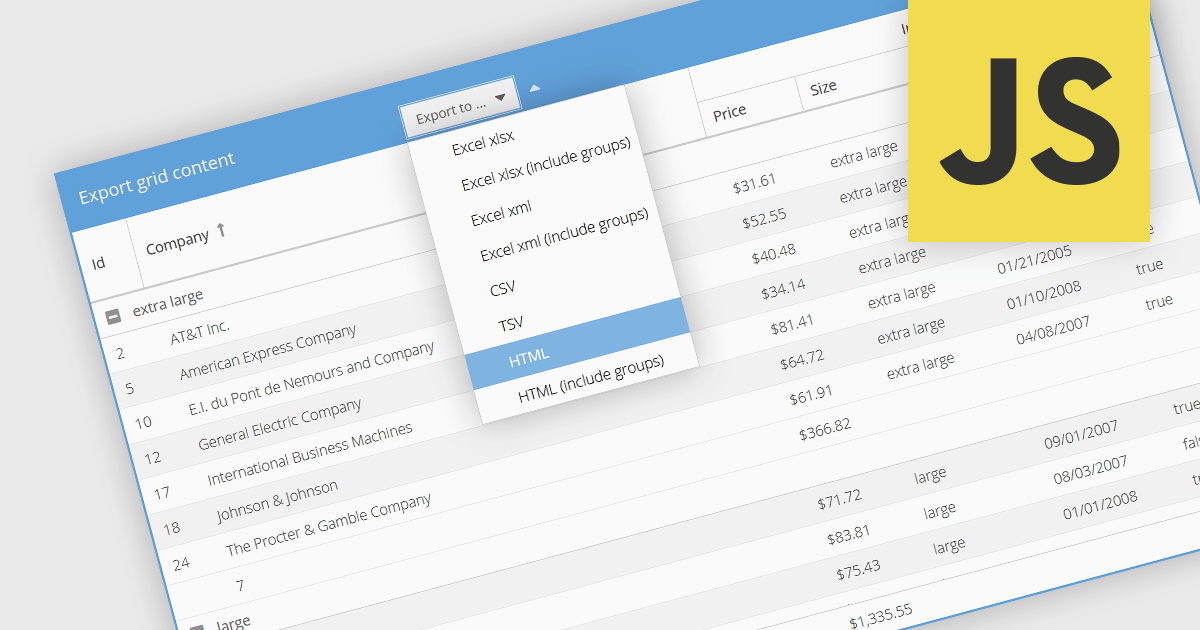
Exporting grid data to HTML is a valuable feature in grid components, enabling developers to generate structured, web-friendly representations of their datasets. This capability allows users to capture the current state of a grid, including applied filters, sorting, and formatting, and convert it into a HTML document for sharing, archiving, or further processing. By preserving the layout and styling, exporting to HTML ensures that the visual integrity of the grid is maintained, making it a convenient alternative to exporting data in static formats like CSV or Excel. The ability to export grids as HTML tables allows you to easily integrate the resultant file with web applications, and makes grid applications more useful. This provides flexibility that makes them ideal for a variety of use cases, including reporting, data dashboards, and embedding structured data within web pages.
Several JavaScript grid components allow you to export to HTML, including:
For an in-depth analysis of features and price, visit our comparison of JavaScript grid components.
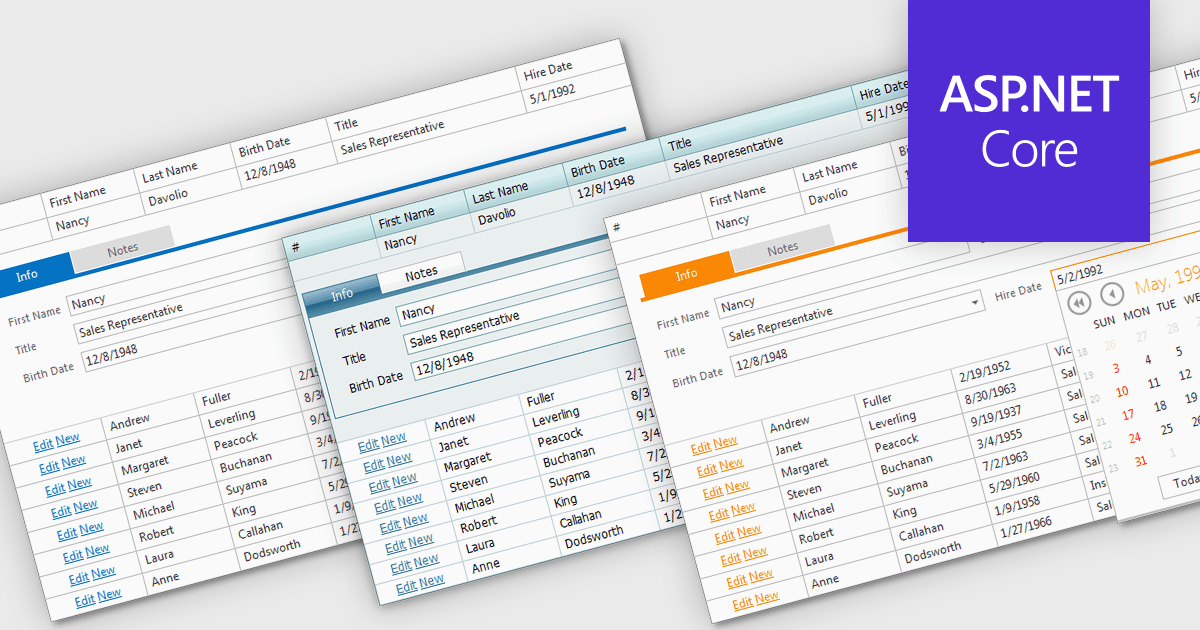
Built-in grid themes are pre-designed styling frameworks within components, providing developers with an efficient way to create visually consistent and professional grid-based interfaces. These themes streamline development by eliminating the need for custom grid designs, ensuring responsiveness across devices, and incorporating accessibility features such as proper color contrast and keyboard navigation. Built-in grid themes enhance the usability and scalability of data-intensive applications, making them ideal for business dashboards, analytics tools, and e-commerce platforms where clean, structured, and polished grid visuals are essential. By leveraging these themes, developers can prioritize functionality while delivering an intuitive, engaging, and inclusive grid experience.
Several ASP.NET Core grid components offer built in theme support including:
For an in-depth analysis of features and price, visit our ASP.NET Core grid controls comparison.
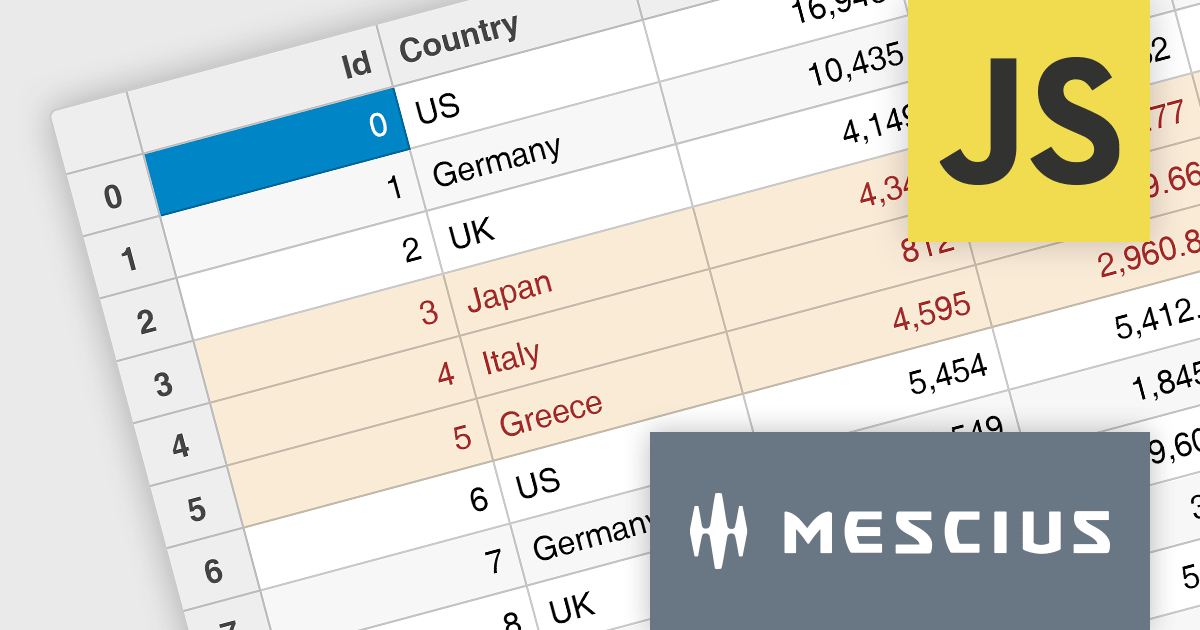
Wijmo by MESCIUS is a comprehensive suite of JavaScript UI components designed for building high-performance, enterprise-grade applications. With its lightweight, modular architecture, Wijmo provides developers with a rich set of tools, including data grids, charts, input controls, and advanced features such as PivotGrid and FinancialChart. Optimized for modern frameworks like React, Angular, and Vue, Wijmo offers seamless integration, flexibility, and extensive customization options.
The Wijmo 2024 v2 Build 5.20242.30 update introduces a new API for cell styling in FlexGrid, providing developers with greater control and precision in customizing grid appearance. This enhancement allows developers to dynamically apply styles at the cell level based on data or state, ensuring a tailored and context-aware presentation of grid content. The API streamlines the process of defining and managing styles, reducing complexity and enabling cleaner, more maintainable code. By leveraging this capability, developers can create visually engaging and functionally responsive grids that align with specific application requirements, enhancing both user experience and application performance.
To see a full list of what's new in 2024 v2 Build 5.20242.30, see our release notes.
Wijmo is licensed per developer. Developer licenses are perpetual and include 1 year subscription which provides upgrades, including bug fixes and new features. See our Wijmo licensing page for full details.
Learn more on our Wijmo product page.


Tel.: (888) 850 9911
Fax: +1 770 250 6199


