


Offizieller Lieferant
Als offizieller und autorisierter Distributor beliefern wir Sie mit legitimen Lizenzen direkt von mehr als 200 Softwareherstellern.
Sehen Sie alle unsere Marken.

ONLYOFFICE Docs is a comprehensive online editor, allowing users to create text documents, spreadsheets, presentations, and forms. It enables your users to edit, share, and collaborate on documents online in their preferred browser, within your own application. It is fully compatible with OOXML (Office Open XML) formats and supports popular Microsoft Office and other document formats such as CSV, DOC, DOCX, EPUB, HTML, ODP, ODS, ODT, PDF, PPT, PPTX, RTF, TXT, XLS, and XLSX.
The ONLYOFFICE Docs v8.2 update adds support for performing iterative calculations. This enables formulas to be repeatedly recalculated until a specific, stable result is reached or a set number of attempts is made. By setting iteration limits and defining acceptable precision levels, iterative calculations enable users to control the number of recalculations, allowing the formula to reach an approximation or convergence point that serves as the final value. This process is particularly useful when dealing with circular references, where a formula refers to its own cell either directly or through a sequence of references involving other cells. Without iterative calculations, such formulas would produce errors, as they would require an infinite loop of recalculations. This is widely used in scenarios requiring complex dependencies, such as financial projections, engineering simulations, and scientific modeling.
To see a full list of what's new in v8.2.0, see our release notes.
ONLYOFFICE Docs is licensed by the number of simultaneous document connections and is available as an annual license with 1 year support and upgrades. See our ONLYOFFICE Docs licensing page for full details.
For more information, see our ONLYOFFICE Docs product page.
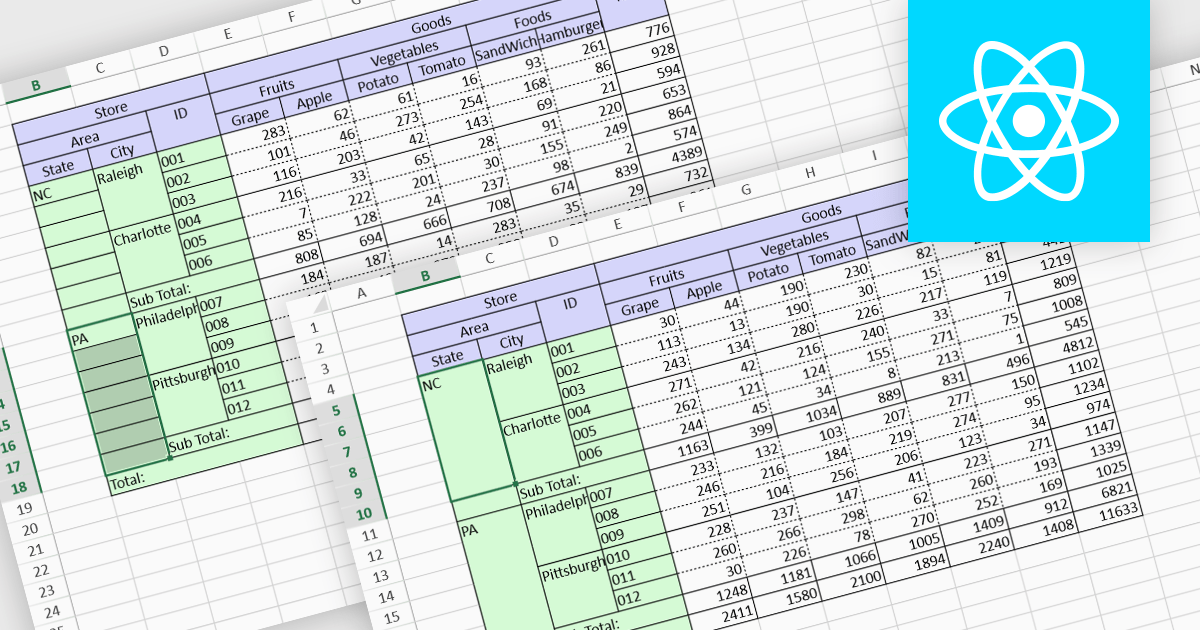
Cell merging is a spreadsheet feature that combines two or more adjacent cells into a single, larger cell, creating a unified space for data. This is particularly useful for creating visually organized and readable spreadsheets, allowing headers to span multiple columns or rows, enhancing clarity and alignment in complex data sets. By merging cells, users can create more structured layouts, making the data presentation cleaner and often easier to understand at a glance. For example, in financial reporting or project tracking sheets, merging cells can emphasize titles, group categories, or highlight specific sections of data, adding visual polish. It can also help when building dashboards, forms, and reports where visual hierarchy and structured information flow are essential for end-user readability and comprehension.
Several React spreadsheet controls offer the ability to merge cells including:
For an in-depth analysis of features and price, visit our React spreadsheet controls comparison.
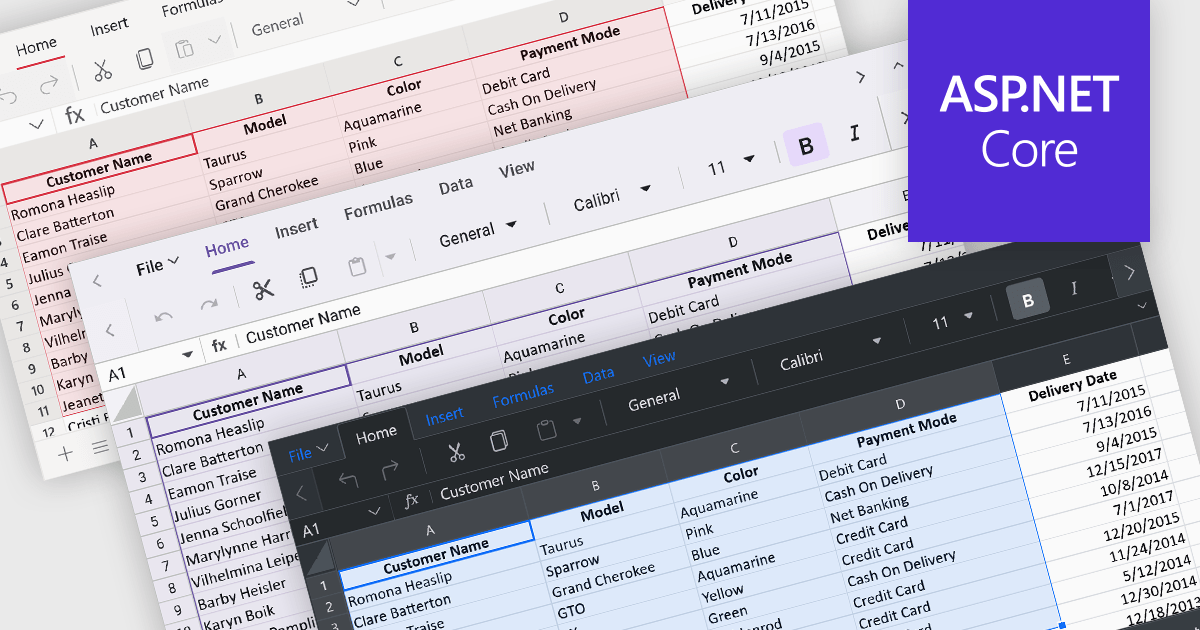
Theming provides users with the ability to customized the visual elements like colors, fonts, and layouts to create a consistent and visually appealing user interface to their spreadsheets. By applying themes, you can enhance the overall aesthetic of your spreadsheet, improve readability, and make it more engaging for users. Themes can also help to align your spreadsheet with your brand guidelines, creating a cohesive and professional look.
Several ASP.NET Core spreadsheet controls offer support for applying themes including:
For an in-depth analysis of features and price, visit our ASP.NET Core spreadsheet controls comparison.
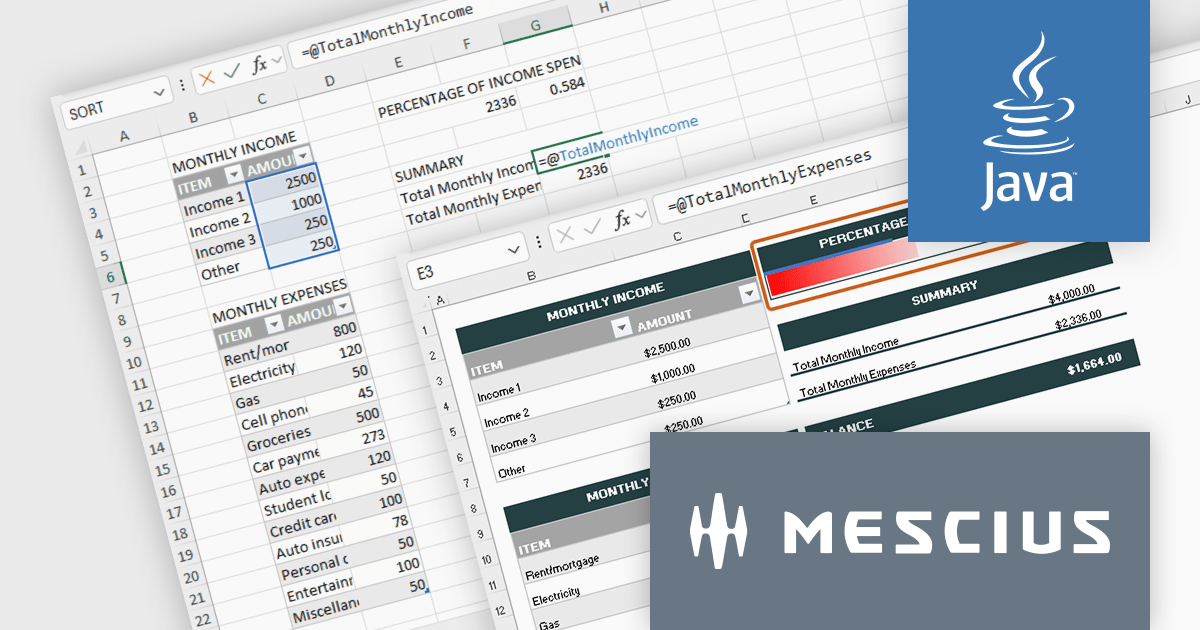
Document Solutions for Excel, Java Edition is a high-speed Java Excel spreadsheet API library that that enables you to programmatically create, edit, import, and export Excel XSLX spreadsheets from Java applications. Develop in Java for Windows, Linux, and Mac and deploy to the Cloud, including Azure, AWS, and AWS Lambda. The interface-based API is modeled on Excel's document object model, which means you can import, calculate, query, generate, and export any spreadsheet scenario, create full reports, sort/filter tables, sort/filter pivot tables, dashboard reports, add charts, sparklines, conditional formats, import and export Excel templates and also convert spreadsheets to PDF, HTML, or an Image type.
In this blog post, MESCIUS Product Marketing Specialist Mackenzie Albitz takes you through the steps for adding an Excel API to your Java application, including:
Detailed instruction and sample code are included.
Read the full blog to learn how to deploy spreadsheets at scale across Java applications.
Document Solutions for Excel, Java Edition is licensed per developer and is available in several license options for differing distribution needs. Team licenses are also available for multiple developers within the same organization. See our Document Solutions for Excel, Java Edition licensing page for full details.
Learn more on our Document Solutions for Excel, Java Edition product page.
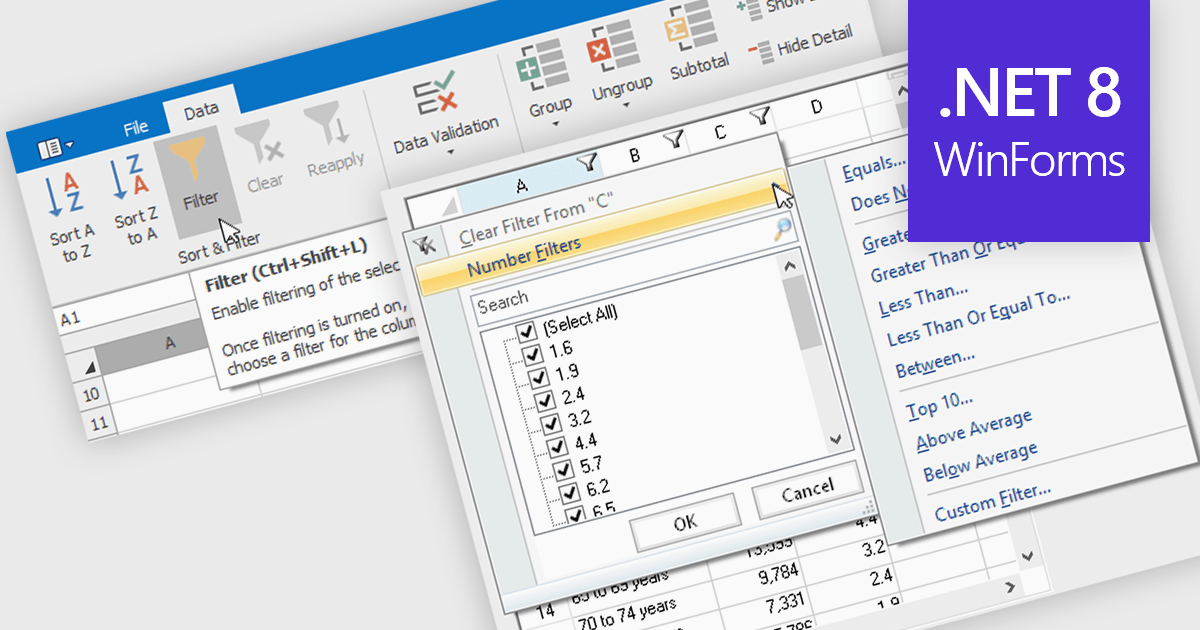
Data filtering and grouping allow spreadsheet users to efficiently organize and analyze information by categorizing and refining it. Filtering allows users to display only the data that meets specific criteria, reducing irrelevant information and focusing on key data points. Grouping, on the other hand, consolidates related rows or columns, facilitating hierarchical data organization and summarization. Together, these features enhance data manipulation capabilities by simplifying complex datasets, improving readability, and allowing for more efficient data analysis. This functionality supports productivity by providing a more structured view of data, making it easier for developers to interpret and work with extensive datasets.
Many .NET 8 WinForms spreadsheet controls contain data filtering and grouping including:
For an in-depth analysis of features and price, visit our comparison of .NET 8 WinForms spreadsheet controls.


Tel.: (888) 850 9911
Fax: +1 770 250 6199


